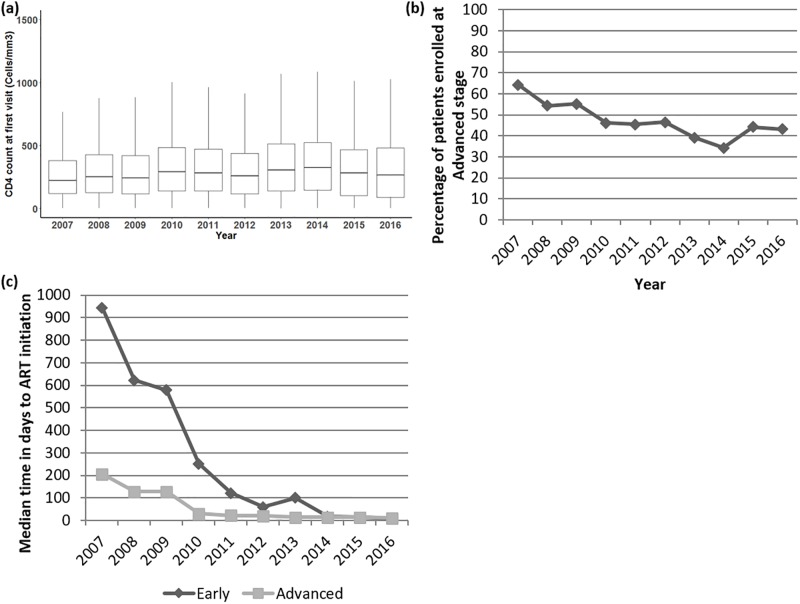
Fig 2. Changes over time in enrollment and stage of presentation at first visit.
(A) Boxplot of median CD4 count at first visit (n = 16007, horizontal line within box representing median value, box lower bounds at 25th centile, upper bounds of box at 75th centile, whiskers represent the largest or smallest value up to a maximum of 1.5x the inter-quartile range with further outliers not plotted), statistical test to determine difference in CD4 count at first visit between years; Kruskal-Wallis p<0.001. (B) Percentage of patients enrolled per year at an advanced stage. Statistical test to determine difference; Exact Fisher test, p<0.001. (C) Median time in days to anti-retroviral initiation in those that started anti-retroviral therapy stratified disease status at first visit (n = 11853). Statistical test of significance; Kruskal-Wallis, p<0.001.

