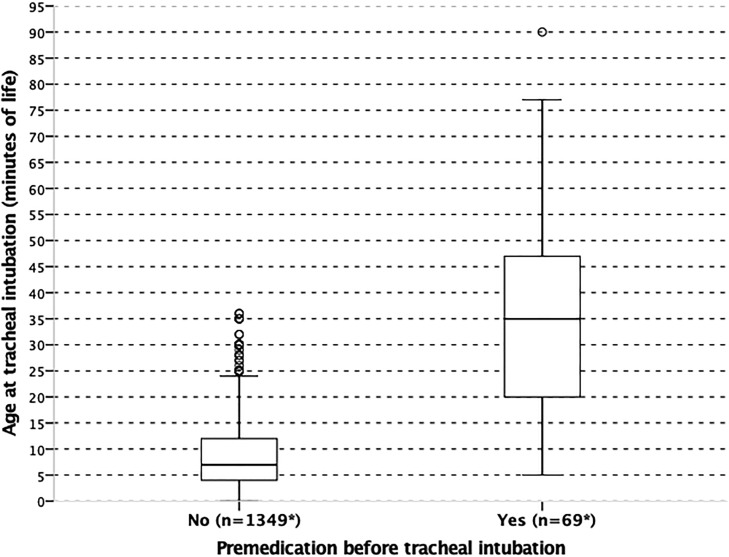
Fig 2. Distribution of age (minutes of life) at tracheal intubation in the delivery room according to premedication.
Boxes represent values between the 1st and the 3rd quartile. The bar inside the box denotes median value. The adjacent values are the most extreme values within 1.5 inter-quartile range of the nearer quartile. All results (except n) are weighted to take into account differences in the sampling process between gestational age groups.

