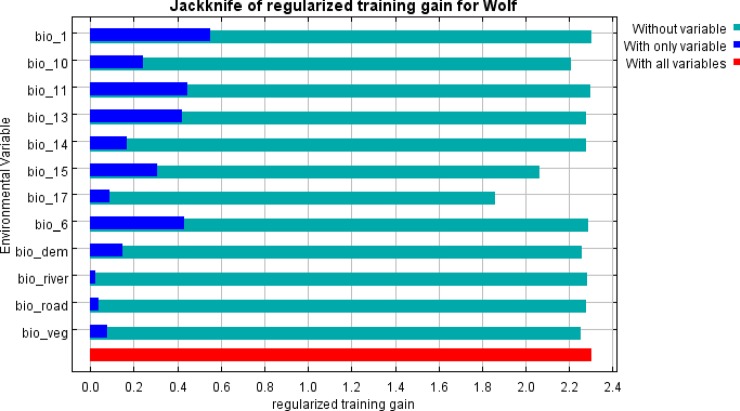
Fig 4. Jackknife test for all the twelve variables.
Blue bar = Shows importance of each variables in explaining the variation in the data when used separately. Green bar = loss in total model gain when the particular variable was dropped, signifies the presence of unique information necessary for explaining the model. Red bar = total model gain.

