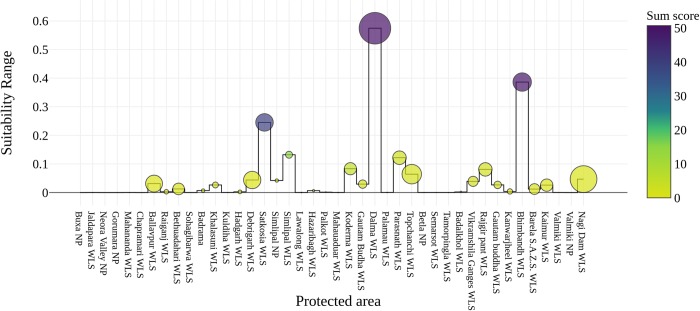
Fig 5. Relation between mean suitability, range suitability and sum of suitability score obtained by PAs.
Values were derived from the zonal statistics calculation for all 42 protected areas extracted from the model output. X axis = Protected area, Y axis = Suitability range score for each PAs. Color ramp depicts the sum value of suitability score size of circle represents mean suitability values obtained by respective PAs.

