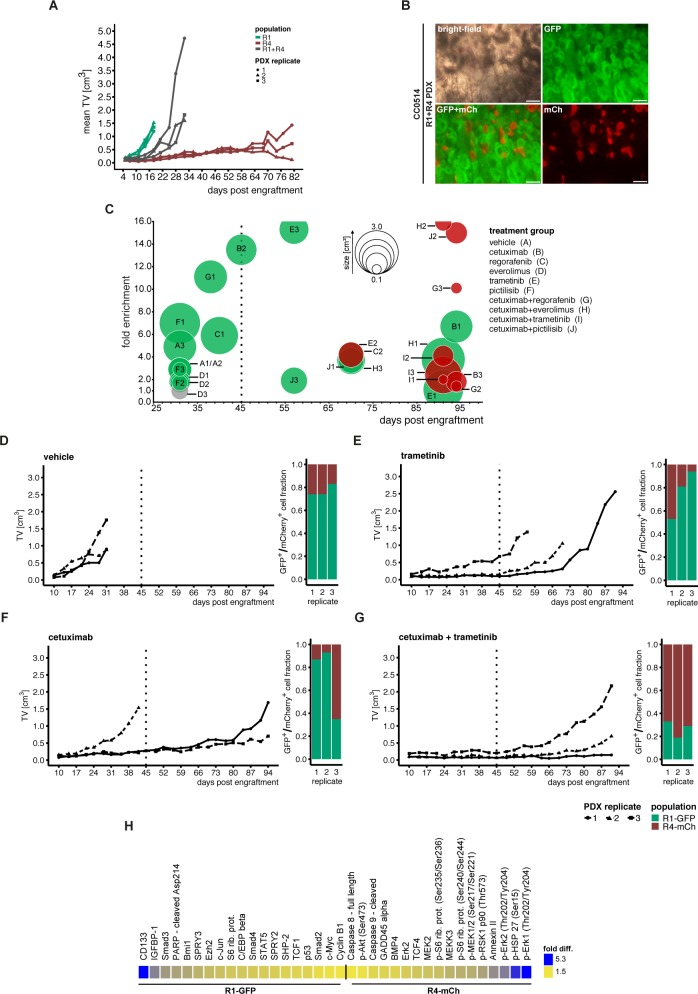
Fig 7. Subpopulation-specific response to in vivo drug treatment.
(A) Cells of sibling cultures CC0514-R1 and CC0514-R4 were transduced with PKF-GFP and PGK-mCherry (mCh) markers, respectively. 1.0×10⁶ cells were injected into nude mice either as single populations (green/red) or as a 1:1 mixture of both populations (grey) in triplicate. (B) Microscopic images of a mixed R1-PGK-GFP and R4-PGK-mCherry tumor, scale bars: 200μm. (C) Mixed populations of R1 and R4 cultures were subjected to treatment in vivo in triplicate. Treatments started 10 days post injection included 5 single compounds and combinations with cetuximab. Treatments were carried out until 45 days (dashed line), if possible. PDX tumors showing minor growth post treatment were maintained in vivo to monitor subsequent growth. The bubble plot shows tumor sizes, as represented by bubble diameter, and fold enrichment of cell subpopulations for all replicates in treatment groups A-J (displayed in the figure). Green (= GFP+) or red (mCherry+ = mCh+) fills indicate which subpopulation was more abundant in the PDX tumor, as measured by FACS analysis of re-suspended tumor cells. Grey circles indicate a 50:50 distribution of labelled tumors. Note that for PDX tumors C2 and E2 both fold enrichment and tumor size were at a similar range (S11 and S12 Tables). (D-G) Tumor growth kinetics during the course of the in vivo mixing experiment are shown together with the fractions of GFP+ and mCh+ populations at the end of the experiment (FACS analysis). Treatments were done with vehicle, trametinib, cetuximab and cetuximab+trametinib combination. (H) Protein expression of CC0514-R1-GFP and CC0514-R4-mCh organoids analyzed by DigiWest protein assay. Difference in fold expression ranging from 1.5 (yellow) to 5.3 (blue).

