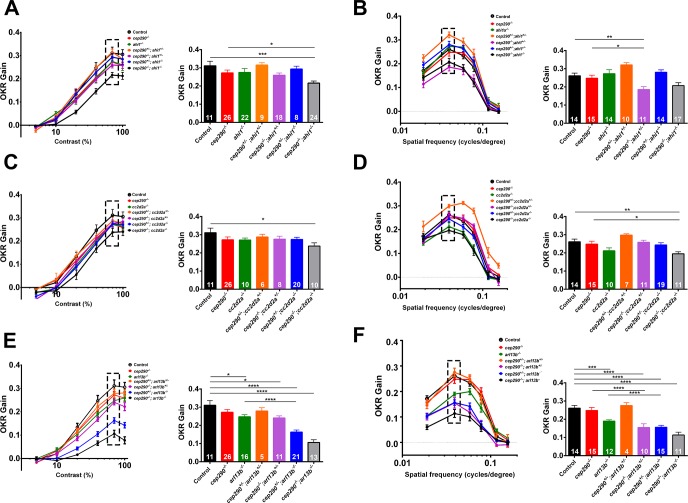
Fig 12. Loss of ahi1 or arl13b impairs visual function of cep290fh297/fh297 mutants.
(A, C, E) OKR contrast response function of 5 dpf larvae (left) and bar graph (right) of corresponding data points at the 70% contrast setting (hatched box). (B, D, F) OKR spatial resolution results of 5 dpf larvae (left) and bar graph of corresponding data points at the 0.039 spatial frequency (hatched box). Genotypes are indicated in the legend and in the X-axes. Inset values indicate the total number larvae tested for each genotype. * P < 0.05; ** P < 0.01; *** P < 0.001; ****P < 0.0001 as determined by a 2-way ANOVA with a Multiple Comparisons test and Tukey corrections. Data are presented as means ± s.e.m.

