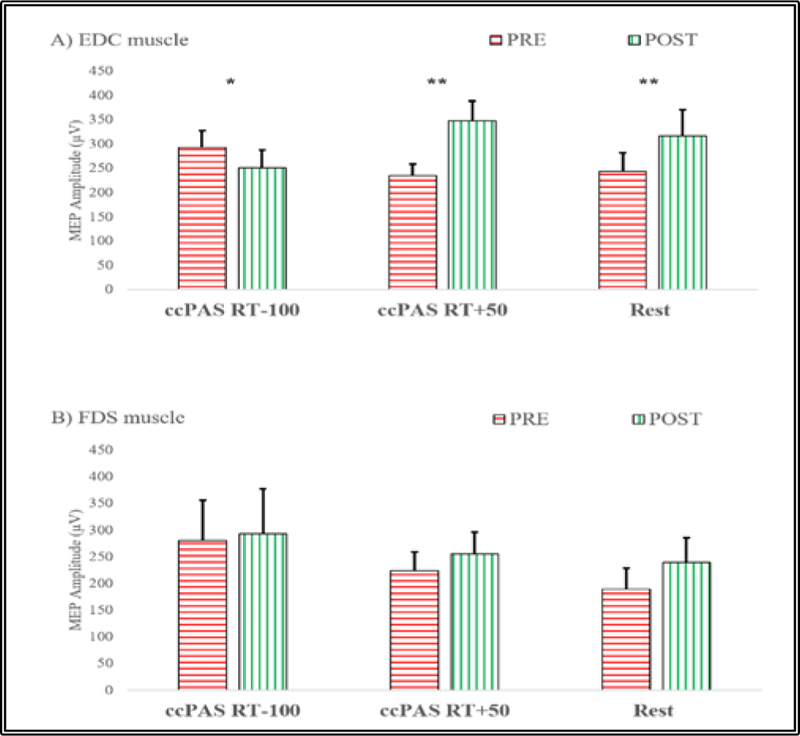
Figure 3.

Effect of PAS on MEP amplitudes (mean±SEM) before (PRE) and after (POST) PAS sessions in: A) targeted right EDC muscle: MEP decrease was observed when the TMS was triggered 100 ms before the estimated movement onset in the left EDC while MEP increase was observed when TMS was delivered 50ms after the estimated movement onset in the left EDC as well as in the PAS_Rest condition. B) untargeted right FDS: no significant changes were observed. (Paired t-test, * denotes p<0.05, ** denotes p<0.01).
