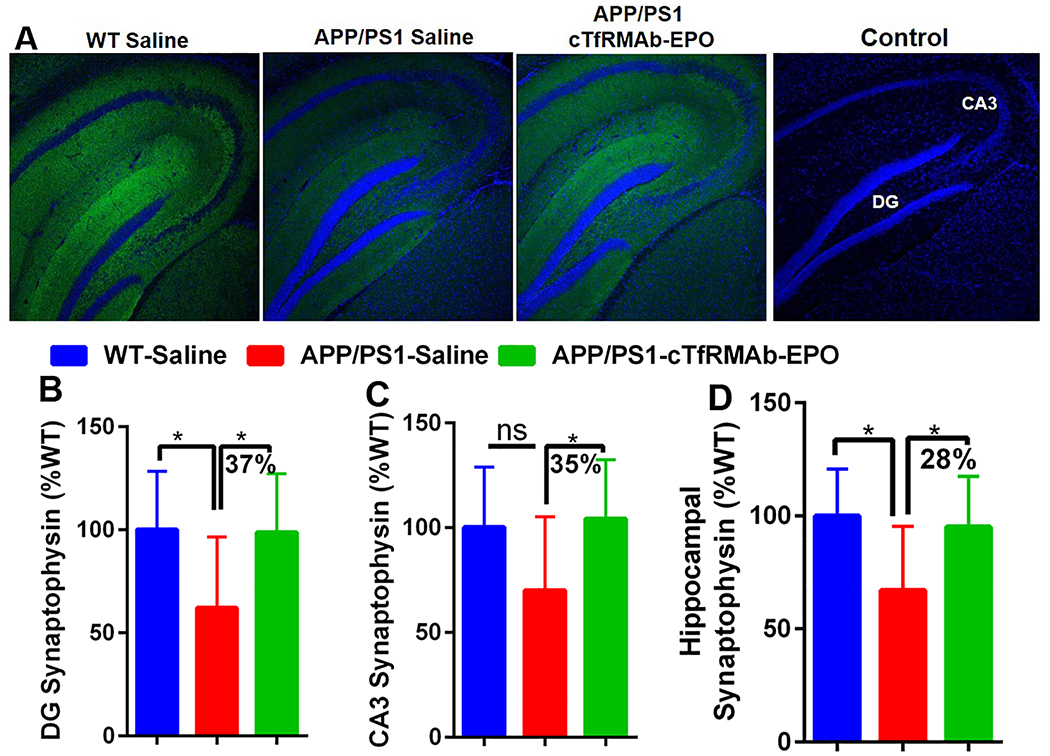
Figure 6. Effect of the cTfRMAb-EPO fusion protein on synaptophysin, a marker of synaptic loss, in the APP/PS1 mice.
Representative images of hippocampal synaptophysin positive immunostaining (green) in the saline treated WT, saline treated APP/PS1 and cTfRMAb-EPO treated APP/PS1 mice. Primary antibody omitted section represents the control. Blue stain represents DRAQ5 positive nuclei (A). Significantly higher synaptophysin positive MFI in the DG (B), CA3 (C) and total (D) hippocampal region in the cTfRMAb-EPO treated APP/S1 mice compared with the saline treated APP/PS1 mice. Data are presented as mean ± SD of 8–10 mice per group. One-way ANOVA with Bonferroni’s correction for equal variance or Games-Howell for unequal variance, or Kruskal Wallis with Dunn’s correction. *p<0.05.

