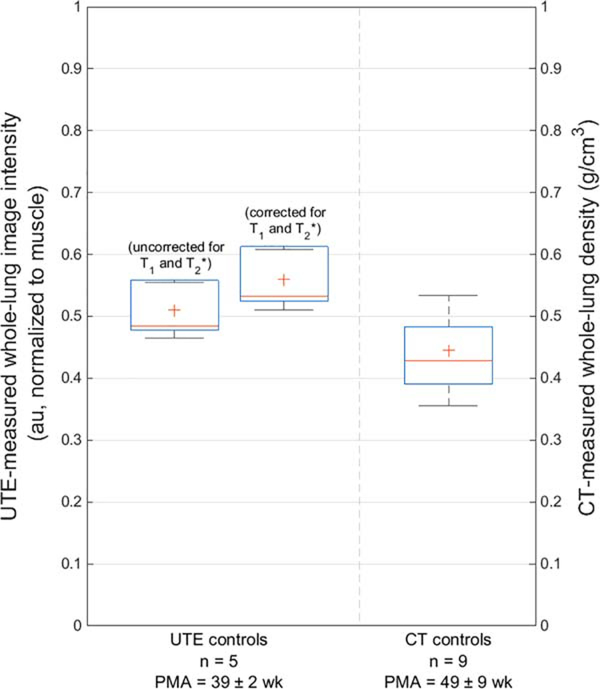
FIGURE 2:
A comparison of mean normalized UTE-measured image intensity (0.51±0.04 au when uncorrected for T1 and , left; 0.56±0.05 au when corrected, middle) and mean CT-measured density (0.44±0.09 g/cm3, right) from whole-lung parenchyma in control subjects. Both uncorrected and corrected UTE-measured intensities measure a slightly higher value than CT-measured density (P=0.062 and 0.062, respectively). Note that the CT control cohort was on average 10 weeks older than the MRI control cohort; PMA of both cohorts are provided (mean±standard deviation).

