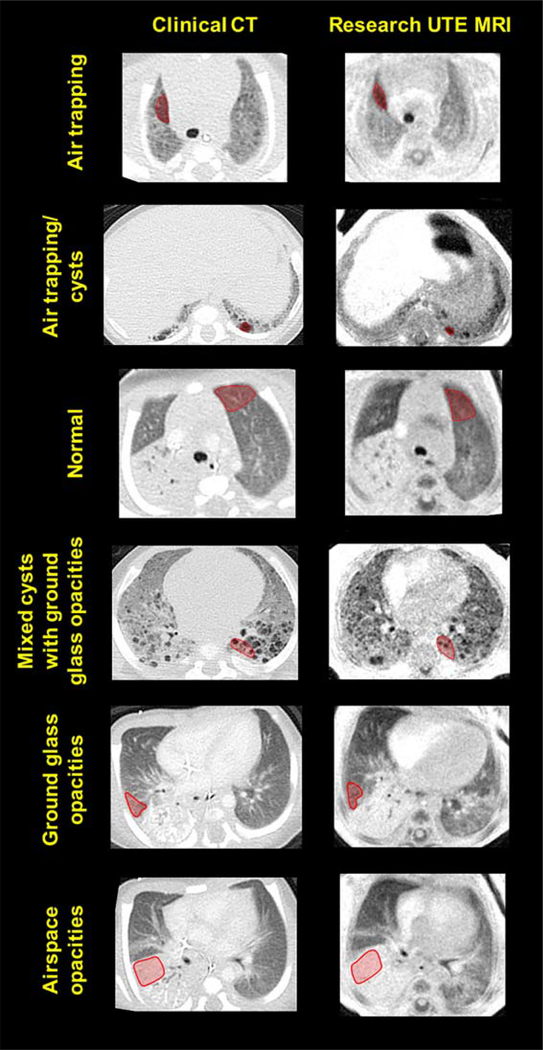
FIGURE 4:
Representative regions of interest (ROIs: red overlay) of six radiological classifications with varying densities on slice-matched CT images (left column) and UTE MR images (right column) from neonates with pulmonary morbidities. From top to bottom: air trapping, air trapping/cysts, normal tissue, mixed cysts with ground glass opacities, ground glass opacities, and airspace opacities.

