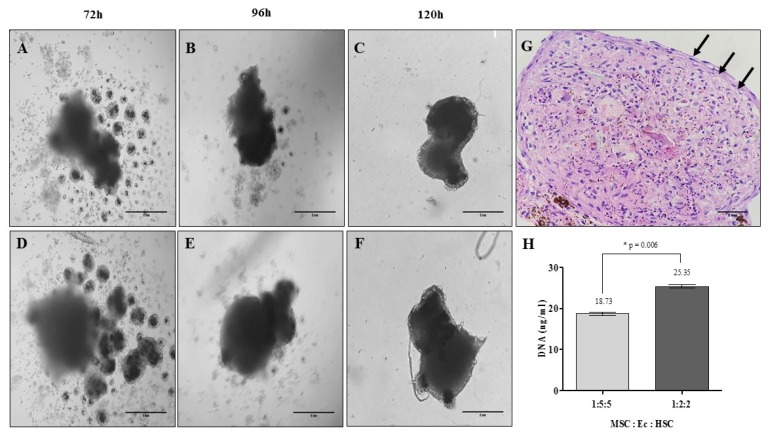
Fig. 3.
Organotypic multicellular spheroid (OMS) formation after 5 days: time vs. cell density. (A~C) Relation 1:5:5 MSC:Ec:HSC (×20, inverted microscopy. Scale bar: 5 mm), (D~F) Relation 1:2:2 MSC:Ec:HSC (Total cell density 1×10⁵ cells) (×20, inverted microscopy. Scale bar: 5 mm). (G) Morphology of OMS after 5 days of culture. It shows cells that are organized in the periphery of the structure demilitarizing the sphere (Relation 1:2:2 MSC:Ec:HSC. ×40, hematoxylin & eosin. Scale bar: 5 mm). (H) DNA quantification in the spheres of the two experimental conditions (p<0.05).

