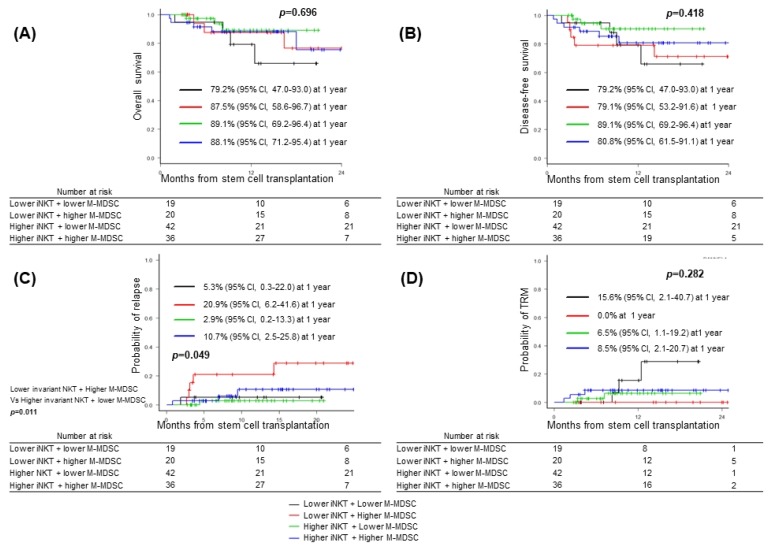
Fig. 2.
Major outcomes accoring to the combinations of frequency of invariant natural killer cells (iNKT) and monocytic myeloid-derived suppressor cell population (M-MDSC). Black line, lower iNKT (≤ 0.027%) + lower M-MDSC (≤ 0.27%), n=19; Red line, lower iNKT (≤ 0.027%) + higher M-MDSC (> 0.27%), n=20; Green line, higher iNKT (> 0.027%) + lower M-MDSC (≤ 0.27%), n=42; Blue line, higher iNKT (> 0.027%) + lower M-MDSC (> 0.27%), n=36. (A) Overall survival, (B) disease-free survival, (C) cumulative incidence of relaspse, and (D) cumualtive incidence of transplant-related mortality (TRM).

