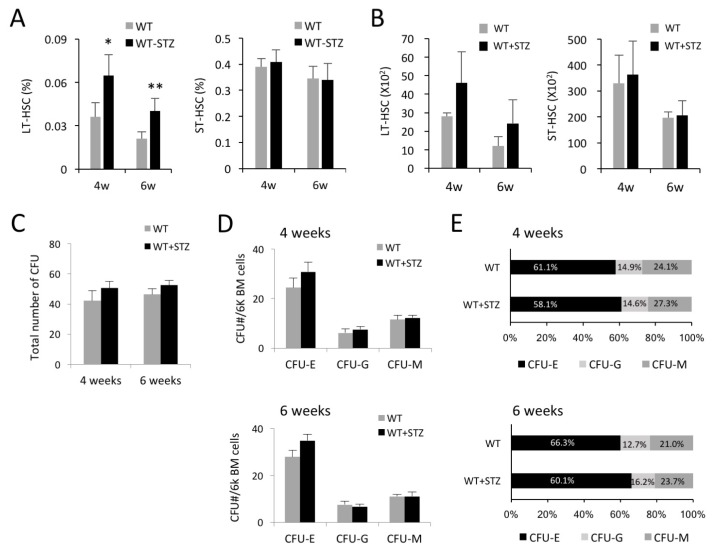
Fig. 2.
Characterization of the HSCs in the BM of STZ-treated diabetic mice and control. (A) Frequency of LT-HSC and ST-HSC in different phases of STZ-treated diabetic and control mice. WT (n=20), STZ-treated mouse (n=28). Data are mean±SD., *p<0.05. (B) The cell counts of LT- and ST-HSC of BM cells in different phases of STZ-treated diabetic and control mice. (C) CFU colony numbers of BM cells in different phases of STZ-treated diabetic and control mice. (D) Number of CFU-E,-G,-M per 6000 cells of BM cells in different phases of STZ-treated diabetic and control mice. (E) Distribution of CFU-E,-G,-M as a percentage of BM cells in different phases of STZ-treated diabetic and control mice. WT (n=6), STZ-treated mice (n=6).

