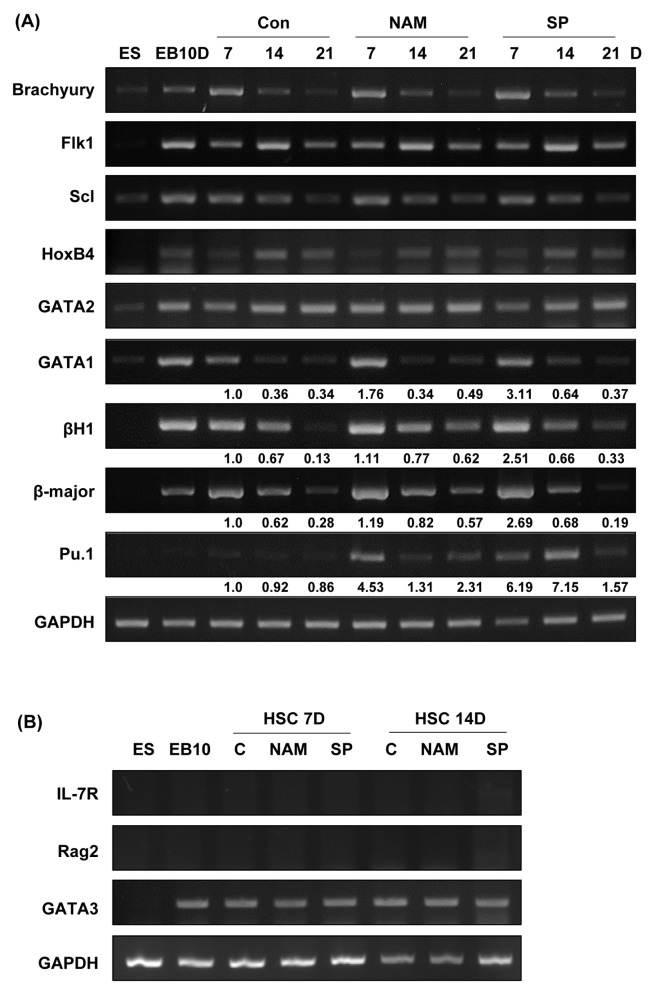
Fig. 3.
Effects of SIRT1 inhibitors on the expression of mesodermal and hematopoietic marker genes during the hematopoietic differentiation of mES cells. (A) RNA samples were extracted on days 7, 14, and 21 during second hematopoietic differentiation, and gene expression was analyzed by RT-PCR. GAPDH is shown as a control. ES: mES cells, EB 10D: embryoid bodies obtained on day 10 of primary differentiation. Mesodermal marker, brachyury; hematopoietic stem cell and progenitor cell markers, Scl, Flk1, and HoxB4; hematopoietic lineage cell markers, GATA1 and GATA2; erythroid specific markers, βH-1 and β-major; early myeloid and lymphoid progenitor marker, Pu.1. The density of each band was measured using the ImageJ program and normalized with the density of GAPDH used as a loading control for each sample. The relative band density values were compared with the controls on day 7 (shown as fold expression). (B) RNA samples were extracted on days 7 and 14 during second hematopoietic differentiation, and gene expression was analyzed by RT-PCR. IL-7R, Rag2, and GATA3 were used as lymphoid lineage markers.

