. 2019 Mar 28;8:e44903. doi: 10.7554/eLife.44903

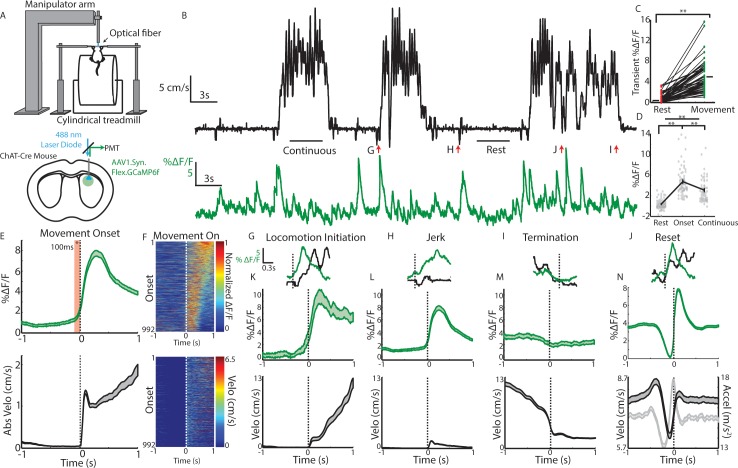
Figure 1. Cholinergic interneuron populations are rapidly activated at spontaneous movement onsets.

(A) Schematic of experimental setup. Acute fiber photometry recordings from GCaMP6f expressing ChIs in dorsal striatum (bottom) in head fixed mice moving spontaneously on 1D treadmill in darkness (top). (B) Representative population fluorescence changes (DF/F, green) from ChIs during spontaneous treadmill movement (velocity, black). (C) Mean transient DF/F for each recording (n = 62 sessions, 19 mice) during rest or movement periods. (D) Mean DF/F during all rest, onset, and continuous locomotion periods for the sessions in (C). (E) Mean DF/F (top) and velocity (bottom) aligned on the onset of all clean movement onsets from rest (see Materials and methods, n = 992 onsets, 16 mice). Shaded region DF/F greater than mean of all rest periods, p<0.01 Wilcoxon Rank-Sum test. (F) All peak normalized traces (top) and velocites (bottom) aligned on movement onsets and sorted by peak responses. (G) Zoomed DF/F (green) and velocity (black) for the locomotion initiation period indicated in (B). (H) Zoomed jerk period indicated in (B). (I) Zoomed termination period indicated in (B). (J) Zoomed behavior reset indicated in (B). (K) Mean DF/F (top) and velocity (bottom) aligned on the onset of all clean locomotion initiations from rest (n = 83 onsets, nine mice). (L) Mean DF/F (top) and velocity (bottom) aligned on the onset of all clean jerks from rest (n = 543 jerks, 18 mice). (M) Mean DF/F (top) and velocity (bottom) aligned on the onset of all locomotion terminations (n = 251 terminations, 19 mice). (N) Mean DF/F (top) and velocity and acceleration (bottom) aligned on the onset of all positively-going transients during motion (n = 4192 transients, 19 mice). **p<1×10⁻⁶ Wilcoxon Rank Sum Test. Shaded regions represent ±SEM.

Figure 1.

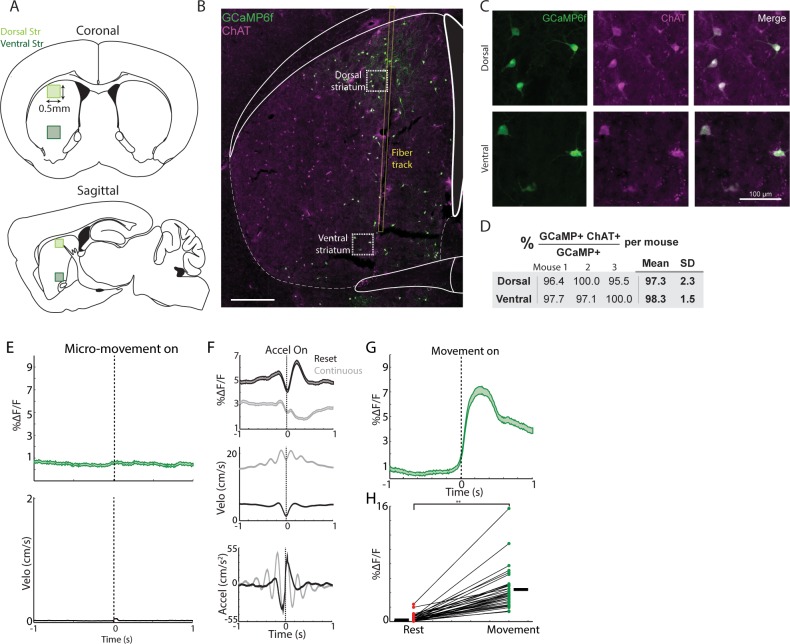
Figure 1—figure supplement 1. Fiber photometry recording sites, histology, and additional properties of movement related ChI signaling.

Figure 1—figure supplement 1.

(A) Coronal (top) and sagittal (bottom) schematics showing the range of recording locations (shaded boxes) in dorsal and ventral striatum. All photometry recording sites were performed within these regions. (B) Representative coronal section from CHAT-cre mouse with cre dependent GCaMP6f expression (green) and immunohistochemical labelling for choline acetyltransferase (purple). The yellow lines indicate the path of the optical fiber for photometry recordings. (C) Zoom-in of the regions indicated by the dashed white boxes in B showing restriction of GCaMP6f expression (green) to ChAT positive cholinergic interneurons (purple). (D) Summary of the percent of GCaMP6f expressing neurons with confirmed co-expression of ChAT from three mice (n = 100, 69, and 50 cells in each respective mouse in dorsal striatum and n = 68, 33, and 46 neurons in ventral striatum). (E) Mean DF/F (top) and velocity (bottom) aligned on the onset of all micro-movement onsets falling below the threshold for movement onsets in Figure 1. (n = 795 onsets, 19 mice). (F) Mean DF/F (top), velocity (mid) and acceleration (bottom) aligned on the zero crossing of accelerations occurring below the 25th percentile of velocities (‘reset’, black) and above the 75th percentile (‘continuous’, grey). (G) Mean DF/F aligned on the onset of all clean movement onsets from rest in mice that had never received rewards on the treadmill (compare with Figure 1C; n = 614 onsets, nine mice). (H) Mean transient DF/F for each recording during rest or movement periods (n = 35 sessions, nine mice) in mice that never received rewards on the treadmill. **p<1×10–15 Wilcoxon Rank Sum Test. Shaded regions represent ±SEM.