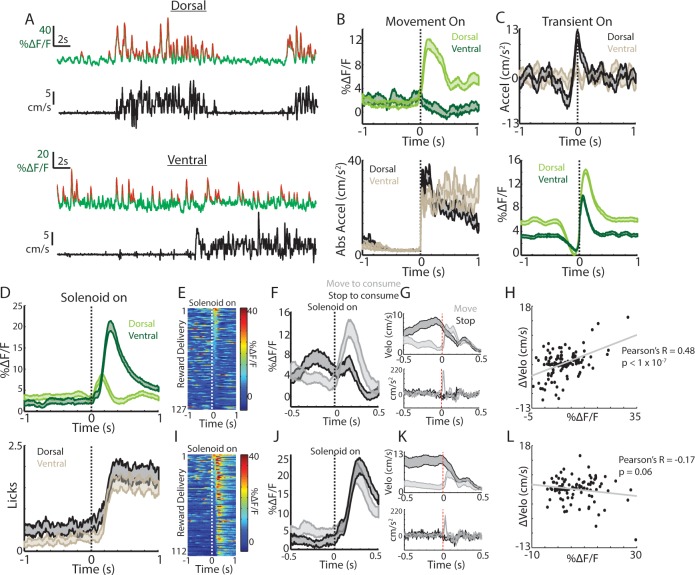
Figure 2. Movement and reward related signals in ChI populations differ across the dorsal-ventral axis of the striatum.
(A) Representative population fluorescence changes (DF/F, green) and velocity (black) from dorsal (top) and ventral (bottom) striatum ChIs during spontaneous movement. Red indicates identified significant positive-going transients. (B) Mean population DF/F (top) and acceleration (bottom) aligned on movement initiations from rest across all dorsal (n = 118 onsets, three mice) and ventral (n = 66 onsets, three mice) ChI recordings without reward deliveries. (C) Mean acceleration (top) and transient population DF/F (bottom) aligned on onsets of significant positive-going transients across dorsal (n = 1215 transients) and ventral (n = 851) ChI recordings without reward. (D) Mean DF/F and spout licking aligned on the unpredicted triggering of the solenoid reward valve for dorsal (n = 127 rewards, 10 mice) and ventral (n = 112 rewards, eight mice) ChI population recordings. (E) DF/F for all unpredicted reward deliveries aligned on solenoid valve trigger for dorsal ChI recordings sorted by peak response. (F) Mean dorsal ChI DF/F for reward deliveries where the mouse stopped to consume the reward from locomotion (bottom quartile of velocity changes at reward delivery, n = 32) or accelerated from a resting state (top quartile, n = 32). (G) Mean velocity (top) and acceleration (bottom) for the deliveries plotted in F. (H) Change in velocity vs the mean dorsal ChI DF/F for each reward delivery. (I) Same as E for ventral ChI recordings. (J) Same as F for ventral ChI recordings (n = 28). (K) Same as G for ventral recordings. (L) Same as H for ventral recordings. Shaded regions represent ±SEM.


