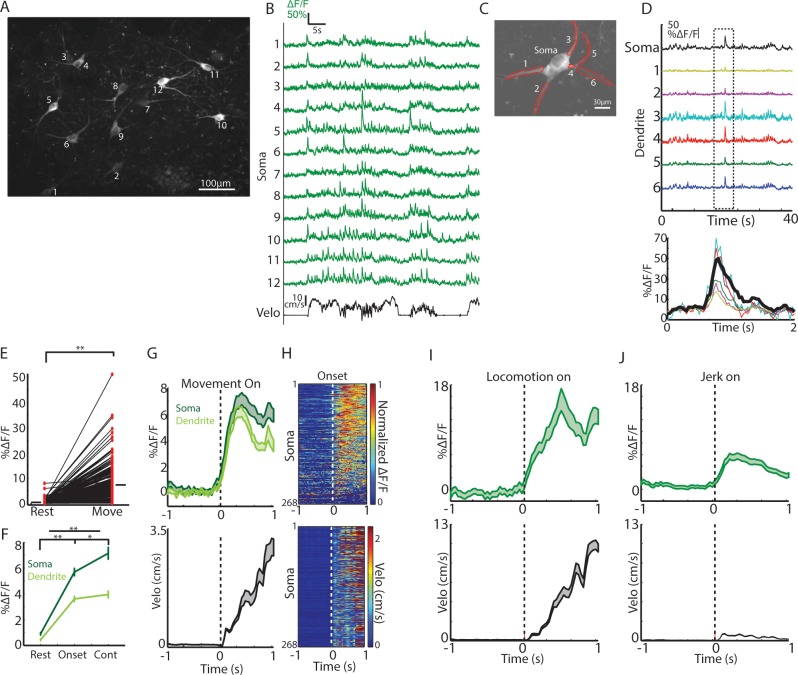
Figure 3. Single ChIs signals are rapidly elevated at movement onsets and throughout locomotion.
(A) Mean fluorescence projection image from 2-photon imaging of a representative field containing multiple distinct GCaMP6f expressing ChIs. (B) DF/F for each of the ROIs in A during a representative behavior period (velocity, black). (C) Mean fluorescence projection image of a single dorsal striatum ChI. Red ROIs indicate dendritic branches. (D) DF/F from the ROIs in C. Note the presence of synchronized transients across all dendrites (period in dashed box zoomed at bottom). (E) Mean transient DF/F during rest and movement periods for all ChIs somata (n = 268 neurons, six mice). (F) Mean transient DF/F across ChIs somata and dendrites for rest, movement onset, and continuous locomotion periods. (G) Mean DF/F (top) across all ChIs and velocity (bottom) aligned on clean movement onsets from rest. (H) Peak normalized mean DF/F for each ChI soma (top) and velocity (bottom) sorted by peak responses at movement initiation. (I) Mean DF/F (top) across ChI somata (n = 96 cells, six mice) and velocity (bottom) aligned on clean locomotion initiations from rest. (J) Mean DF/F (top) across ChI somata (n = 213 cells, six mice) and velocity (bottom) aligned on clean jerk onsets from rest. *p<0.01, **p<1e-8, Wilcoxon rank sum test. Shaded regions represent ±SEM.


