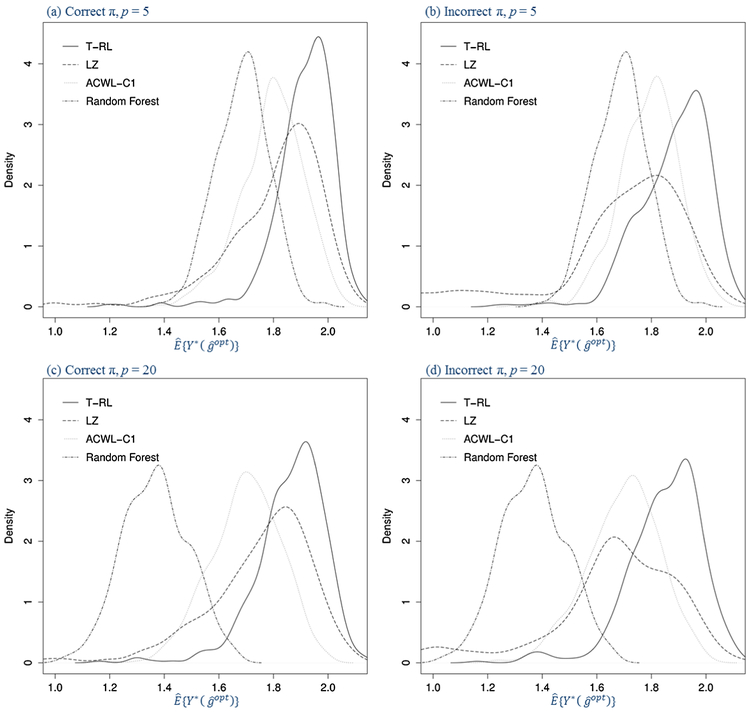
Fig. 2.
Density plots for the estimated counterfactual mean outcome in Scenario 1 with varying penalties for misclassification in the generative outcome model (500 replications, n = 500). The four panels are under correctly or incorrectly specified propensity model (π) and five or twenty baseline covariates (p).

