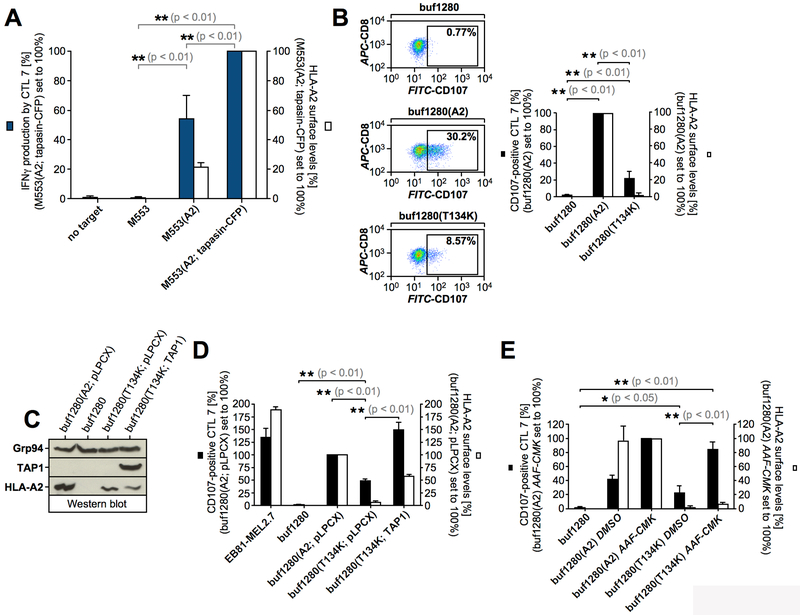
Figure 5, TAP-independent PMEL209-217 presentation occurs in the absence of tapasin assistance.
(A) CTL7 activation measured by IFNγ ELISA (dark blue bars). The experiment was repeated three times and the error bars represent the standard deviation from the mean of these three independent experiments. A One-way ANOVA with Dunnett’s post test was performed for statistical evaluation. Surface-HLA-A2 levels were measured by flow cytometry (white bars). (B, D, E) CTL7 degranulation is shown as in Fig. 1B. CTL7 activation (black bars) and HLA-A2 surface levels on target cells (white bars) are depicted in bar diagrams. The experiment in Fig. 5B was repeated three times. Error bars represent the standard deviation from the mean of these three independent experiments (surface-HLA-A2 levels (white bars) were measured in only two of these three experiments). A One-way ANOVA with Dunnett’s post test was performed for statistical evaluation. The experiment in Fig. 5D was repeated three times (pLPCX, empty vector). Error bars represent the standard deviation from the mean of these three independent experiments. A One-way ANOVA with Dunnett’s post test was performed for statistical evaluation. Data from this experiment was also included in Fig. 3H and 6C. The experiment in Fig. 5E was repeated three times. Error bars represent the standard deviation from the mean of these three independent experiments. A One-way ANOVA with Dunnett’s post test was performed for statistical evaluation. Data from this experiment was also included in Fig. 4D. (C) Expression of HLA-A2 and TAP1 in cells stably transduced with wildtype HLA-A2 or HLA-A2 T134K and co-expressing either empty vector (pLPCX) or TAP1 was analyzed by Western blotting.

