6.

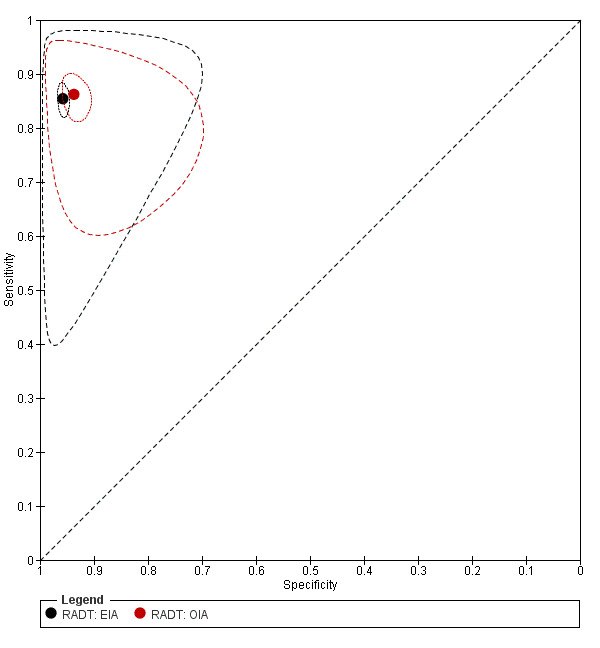
Summary ROC plot of RADT sensitivity and specificity for GAS detection: EIA (n = 86) versus OIA (n = 19). The filled black circle is the pooled summary estimate for sensitivity and specificity of EIA tests; the filled red circle is the pooled summary estimate for sensitivity and specificity of OIA tests The solid curves represent the 95% confidence region around the summary estimate; the dashed curves represent the 95% prediction region.
