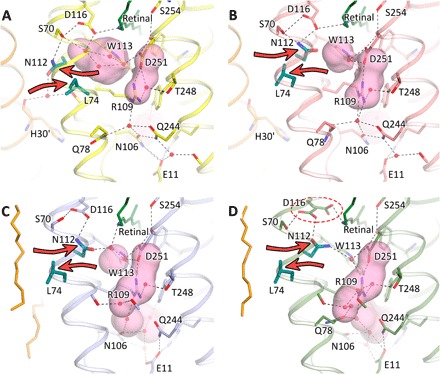
Fig. 3. Comparison of Schiff base region of different KR2 structures.

(A) Chain A of pentameric Na+-pumping form (expanded conformation, pH 8.0) is shown in yellow. (B) Chain E of 4XTN model (compact conformation, pH 4.9) is shown in salmon. (C) The 4XTL model (one of two closely related to compact conformations pH 4.3) is shown in light blue. (D) The 3X3C model (closely related to compact conformation, soaked at pH 8.0 to 9.0) is shown in green. The red dashed ellipse shows double conformation of the Asp116 side chain. Red contoured arrows show the important displacement of the Asn112-Leu74 pair (colored teal). Helix A′ of nearby protomer and fragments of lipid molecules are shown in orange for pentameric and monomeric models, respectively. The cavities are colored pink. The cartoon representation of helix A is hidden for clarity. A prosthetic group retinal is colored dark green.
