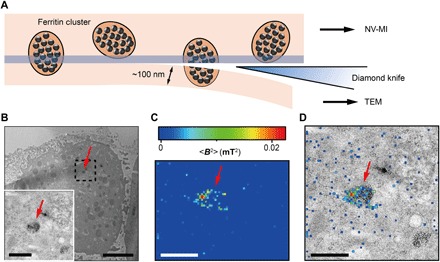
Fig. 3. Correlative MI and TEM images.

(A) Schematic view of sectioning for correlative MI and TEM imaging. The last section and the remaining cube were transferred for TEM imaging and MI scanning, respectively. The sectioning resulted in some split ferritin clusters that could be imaged under both microscopes. A transparent blue strip of ~10 nm indicates the imaging depth of the MI, while in the TEM, the imaging depth is ~100 nm. (B) Distribution of ferritins from the last ultrathin section under TEM. Inset: Magnified figure of the part in black dashed box. (C) MI result of the remaining cell cube. The pixel size is 43 nm. (D) The merged MI and TEM micrograph shows ferritins in a membrane-bound organelle. The red arrows in (B) to (D) indicate the same ferritin cluster. Scale bars, 5 μm (B) and 1 μm [B (inset), C, and D].
