
Fig. 3. AM tree dominance differences between adult trees and saplings in forests across 11 ecoregions of the United States.
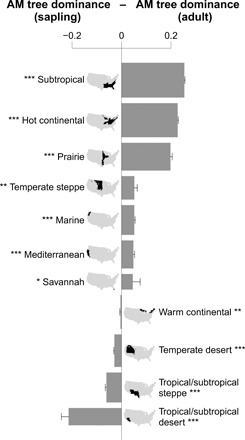
The difference in AM tree dominance between adults and saplings for each ecological region were tested on the basis of a paired Wilcoxon signed-rank test (*P < 0.05; **P < 0.01; ***P < 0.001). Error bars are SEs. The bar thickness is proportional to the number of plots (log scale). Only plots where both adult trees and saplings are present are used for the analysis (98,638 plots).