
Fig. 2. Examples of Hi-C profiles from different species.
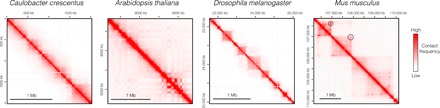
Hi-C maps [visualized with Juicebox (134)] of different species (24, 67, 75, 90, 135) showing more or less pronounced 3D partitioning of the genome. TADs are not obvious in Arabidopsis genome, but boundary-like regions and insulated genome units are discernible. In Drosophila, TADs are well demarcated and correlate well with the epigenetic landscape. A specific feature of mammalian TADs is the presence of “corner peaks,” i.e., peaks of interactions at the edges of TADs (indicated by black circles), revealing the presence of chromatin loops.