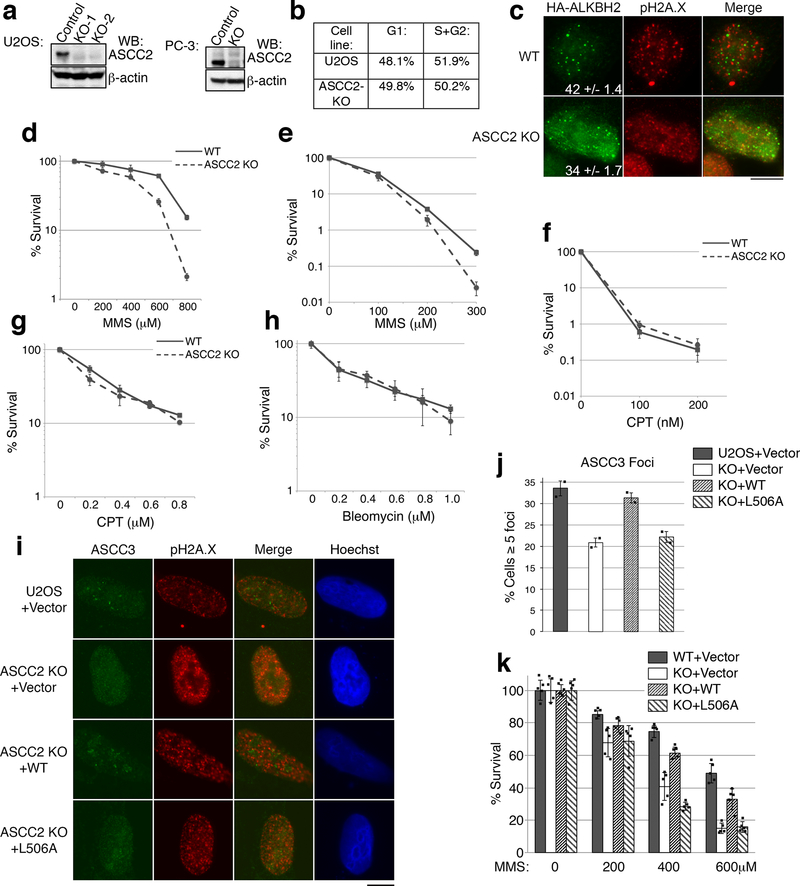
Extended Data Figure 6. Characterization of ASCC2 KO cells.
(a) ASCC2 gene knockouts in U2OS and PC-3 cells were generated using CRISPR/Cas9 technology and verified by deep sequencing. Whole cell lysates of the parental and KO cells were analyzed by Western blotting as shown (n=2 independent experiments). (b) Flow cytometry of WT and ASCC2-KO U2OS cells after MMS treatment to determine cell cycle distribution. (c) Immunofluorescence analysis of HA-ALKBH2 expressing cells after MMS. Numbers indicate the percent of cells expressing five or more HA-ALKBH2 foci (n=3 biological replicates; mean ± S.D.). (d) MMS sensitivity of WT or ASCC2 KO cells using MTS assay (mean ± S.D.; n=5 biological replicates). (e-f) Sensitivity of WT and ASCC2 KO cells to MMS (e) or camptothecin (f) was assessed by clonogenic survival assay (n=4 biological replicates; mean ± S.D.). (g-h) WT PC-3 and ASCC2-KO cell sensitivity to camptothecin (g) or bleomycin (h) using the MTS assay (n=5 biological replicates; mean ± S.D.). (i) Images of WT or ASCC2 KO cells expressing the indicated vectors after MMS exposure. (j) Quantitation of (i) (n=2 independent experiments; mean ± S.D.). (k) WT or ASCC2-KO cells expressing indicated vectors were assessed for sensitivity to MMS using the MTS assay (n=5 technical replicates; mean ±S.D.). Scale bar, 10 μm.

