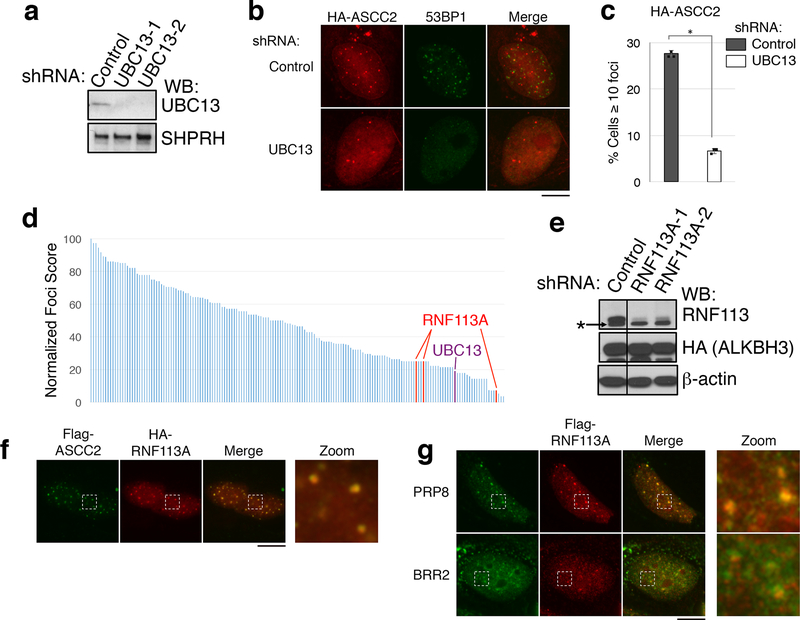
Extended Data Figure 8. Identification of the RNF113A E3 ligase.
(a) Whole cell lysates of U2OS cells infected with the indicated shRNAs were analyzed by Western blot. SHPRH was used as a loading control (n=1 independent experiment). (b) Immunofluorescence images of MMS-induced HA-ASCC2 foci in cells expressing the indicated shRNAs. (c) HA-ASCC2 foci quantitation from (b) (n=3 biological replicates; mean ± S.D.; two-tailed t-test, * = p < 0.001). (d) Compilation of E3 ligase shRNA screen results. For each candidate, U2OS cells were transduced with HA-ASCC2 and an E3 targeting shRNA. MMS-induced HA-ASCC2 foci formation was analyzed by immunofluorescence. Results were normalized to a scrambled shRNA (normalized score = 100). UBC13 denotes the positive control (purple). Results of three different shRNA to RNF113A are indicated in red (n=1 independent experiment for each shRNA). (e) Whole cell lysates of U2OS cells infected with the indicated shRNAs were analyzed by Western blot. Asterisk (*) indicates a non-specific band in the RNF113A blot (n=2 independent experiments). (f) Localization of Flag-ASCC2 and HA-RNF113A after MMS treatment (n=3 biological replicates). (g) Immunofluorescence of cells expressing Flag-RNF113A without MMS treatment (n=3 biological replicates).

