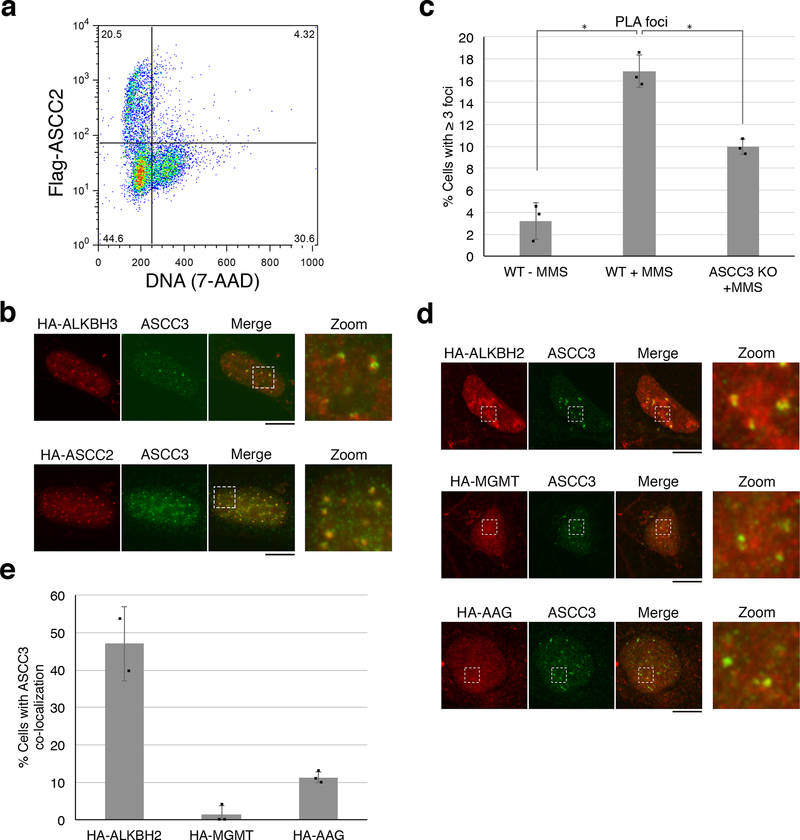
Extended Data Figure 2. Subcellular localization of ASCC2 and other alkylation repair factors.
(a) Flow cytometry analysis of Flag-ASCC2 expressing cells after MMS treatment and Triton X-100 extraction. Numbers indicate the percent of total cells in each quadrant (n=2 independent experiments). (b) Images of cells expressing HA-ASCC2 or HA-ALKBH3 after MMS treatment (n=2 independent experiments). (c) PLA quantitation from Figure 1c (n=3 biological replicates; mean ± S.D.; two-tailed t-test, * = p < 0.005). (d) Immunofluorescence of cells expressing HA-ALKBH2, HA-MGMT, or HA-AAG upon MMS treatment. (e) Quantitation of ASCC3 co-localization from (d) (n=3 biological replicates; mean ± S.D.). Scale bars, 10 μm.

