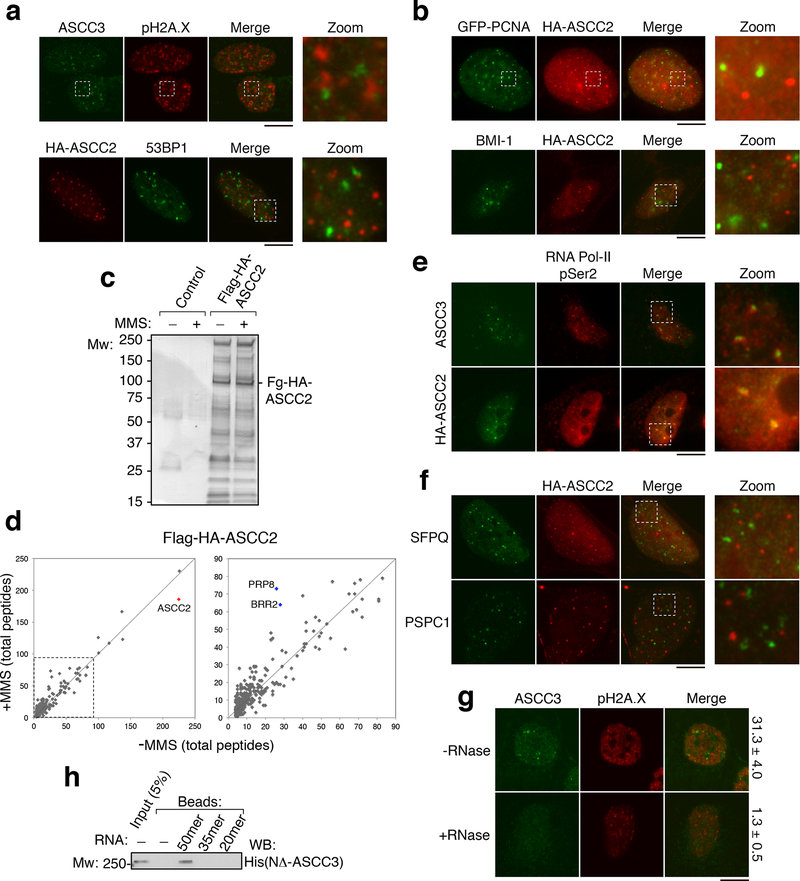
Extended Data Figure 3. Localization and interactions of the ASCC complex.
(a) and (b) Images of U2OS or U2OS cells expressing the indicated vectors after MMS treatment (n=3 biological replicates). (c) Silver staining of the Flag-HA-ASCC2 complex purified from HeLa-S nuclear extract separated on 4%−12% SDS-PAGE gel (n=1 independent experiment). (d) Tagged ASCC2 was purified with or without MMS and analyzed by mass spectrometry. Peptide numbers for identified proteins were plotted for each condition. Expanded view is shown on the right (n=1 independent experiment). (e) and (f) Immunofluorescence analysis of U2OS or HA-ASCC2 expressing U2OS cells upon exposure to MMS (n=3 biological replicates). (g) U2OS cells were treated with MMS, and processed for immunofluorescence with or without initial incubation with RNase A (50 nM). Numbers indicate the percent of cells expressing five or more ASCC3 foci (n=3 biological replicates; mean ± S.D.). (h) Biotinylated RNAs (20mer, 35mer, or 50mer) were immobilized and tested for binding to recombinant His-NΔ-ASCC3 (n=2 independent experiments). Scale bars, 10 μm.

