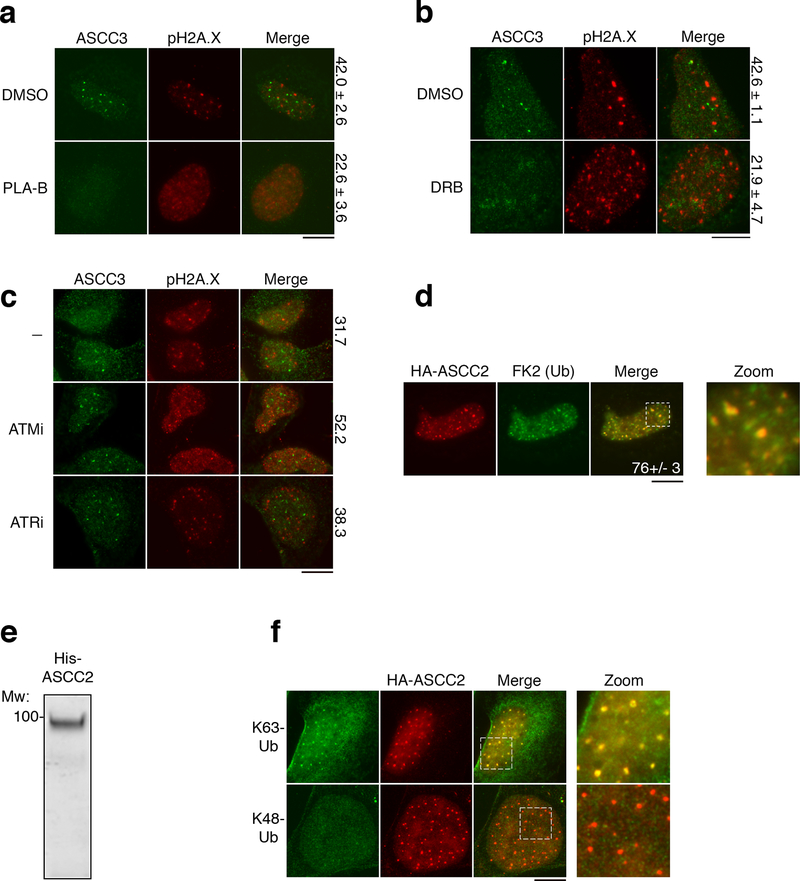
Extended Data Figure 4. Functional interactions of the ASCC complex with other signaling pathways.
Immunofluorescence images of U2OS cells treated with MMS in the presence of spliceosomal inhibitor PLA-B (a) (100 nM; n=3 biological replicates; mean ± S.D.), the RNA Pol II inhibitor DRB (b) (100 μM; n=3 biological replicates; mean ± S.D.), or the indicated damage signaling kinase inhibitor (c) (n=2 biological replicates; mean). Numbers indicate the percent of cells expressing five or more ASCC3 foci. (d) Immunofluorescence of HA-ASCC2 and FK2 in cells after MMS (n=3 biological replicates; mean ± S.D.). (e) His-ASCC2 was purified on Ni-NTA, separated on a 10% SDS-PAGE gel, and analyzed by Coomassie blue staining (n=2 independent experiments). (f) Immunofluorescence of HA-ASCC2 cells and K63-ubiquitin (top) or K48-ubiquitin (bottom) after MMS treatment (n=2 independent experiments). Scale bars, 10 μm.

