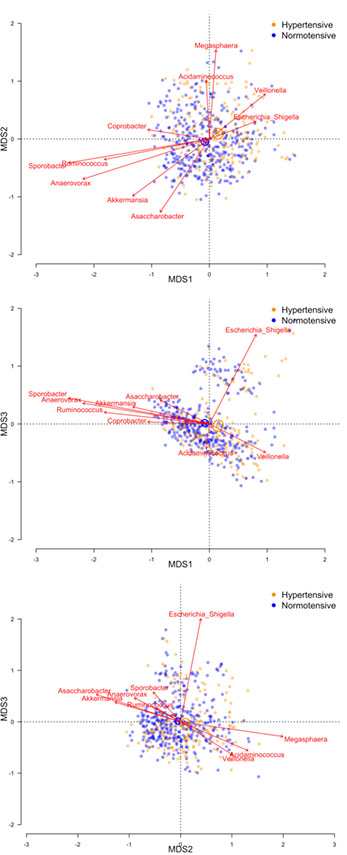
Figure 1.
Microbial similarity biplots (joint PCoA axes) for study participants with hypertension (orange) or normal blood pressure (blue). Biplots shown for PCoA axes that explain at least 5% of variability in microbial similarity. Centroids illustrate the 95% confidence interval for the mean location of each population group. The ten most abundant genera are shown with respect to their directional association along PCoA axes, with vector length indicating the strength of association. PERMANOVA p-values were 0.001 for hypertension in each of the five multivariable-adjusted models. Model 1 adjusted for sequencing run; Model 2 additionally adjusted for age, race, gender, study center, and educational attainment; Model 3 additionally adjusted for smoking, physical activity, and diet quality score; Model 4 additionally adjusted for BMI; Model 5: adjusted for Model 3 covariates, with the addition of waist circumference.

