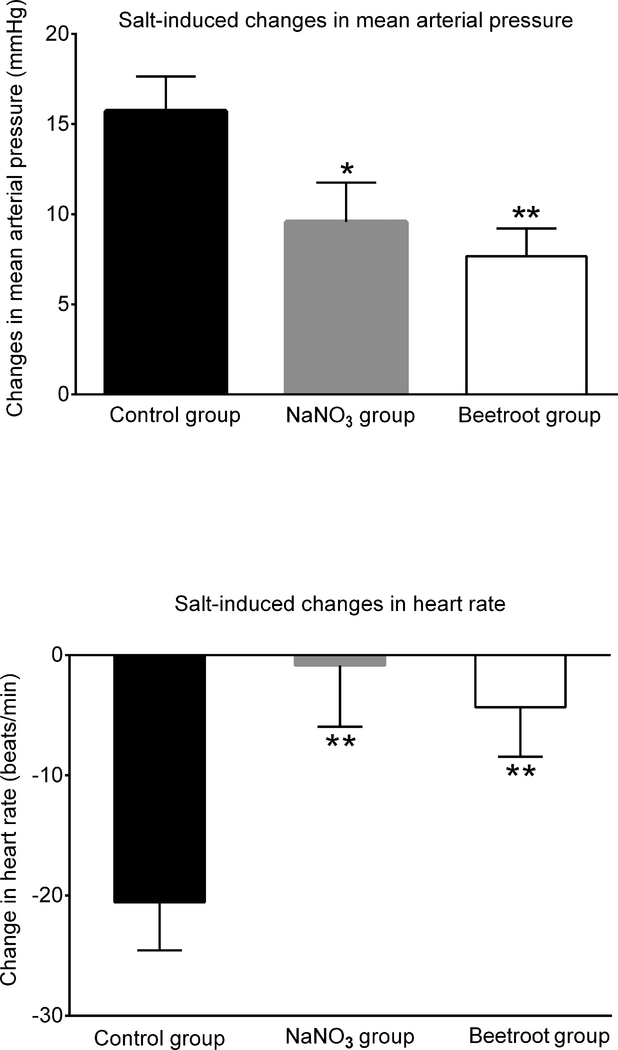
Figure 2.
Changes in 24-hour averages for mean arterial pressure and heart rate induced by salt-loading. Top panel: Changes in mean arterial pressure induced by salt loading. Bottom panel: Changes in heart rate induced by salt loading. The salt-induced changes in mean arterial pressure and heart rate were determined by subtracting the average results over the last 3 days on the low salt diet from the average results over the last 3 days on the high salt diet. Statistical significance was determined by ANOVA with Holm Sidak testing to adjust for multiple comparisons. * denotes adjusted P <0.05 compared to the salt-loaded control group. ** denotes adjusted P< 0.025 compared to the salt-loaded control group. The salt-induced changes in mean arterial pressure were 15.7 ± 1.9 mmHg in the control group, 9.5 ± 2.1 mmHg in the sodium nitrate group, and 7.6 ± 1.5 mmHg in the beetroot group.

