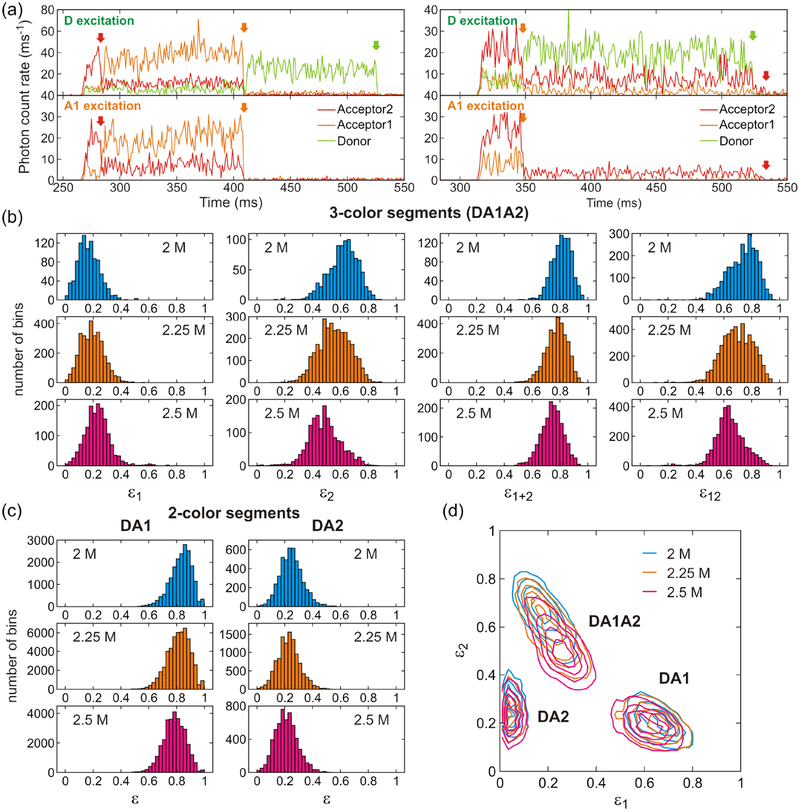
Figure 4.
Fluorescence trajectories and FRET efficiency histograms in three-color FRET at different GdmCl concentrations. (a) Binned (1 ms bin time) fluorescence trajectories of two molecules (left and right) obtained by donor excitation (upper) and A1 excitation (lower). Donor, A1, and A2 trajectories are colored in light green, orange, and red, respectively. Photobleaching steps are indicated by arrows with the corresponding colors. The residual A2 signal after D (A1) photobleaching by D (A1) excitation trajectory on the right side is direct excitation of A2 by the D (A1) excitation laser. (b) Histograms of uncorrected fractions of acceptor photons ε (eq 7) obtained from the segments in which all three dyes are active. Segments with an average total photon count rate higher than 50 ms−1 were included. ε1 is the fraction of A1 photons (i.e., the number of A1 photons divided by the total number of photons in the bin), ε2 is the fraction of A2 photons, and ε1+2 = ε1 + ε2. These values were calculated from photons emitted after D excitation and collected in 1 ms bins. ε12 was calculated from photons emitted after A1 excitation. (c) FRET efficiency histograms constructed from two-color segments: donor and acceptor 1 (DA1, left) and donor and acceptor 2 (DA2, right). (d) 2D plots of ε1 and ε2 for the different types of segments. 2D contours were smoothed as described in Ref. 51.

