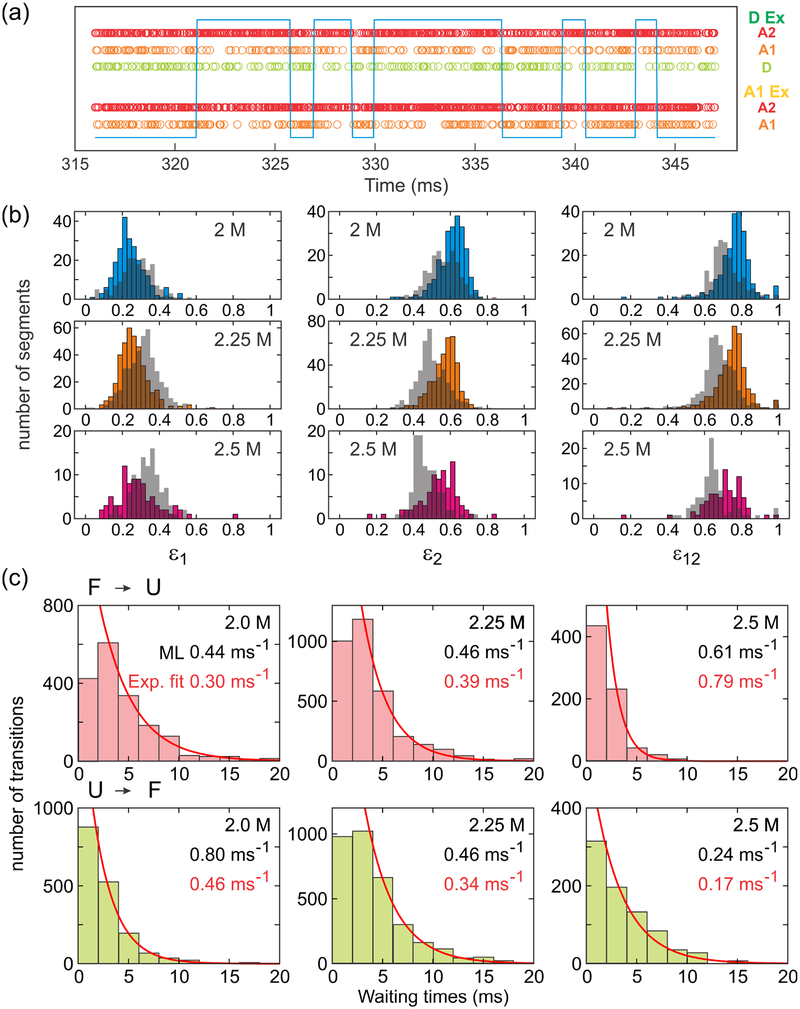
Figure 6.
Identification of transitions at a single photon level. (a) Separation of folded and unfolded states, indicated by high and low levels of the blue line, respectively, in a photon trajectory using the Viterbi algorithm. In the folded state, a small number of D and A1 photons are detected due to the high energy transfers to A2. (b) Acceptor fraction ε histograms of folded (colored bars) and unfolded (grey bars) states constructed from photon trajectory segments separated by the Viterbi algorithm. FRET efficiencies were calculated for the segments containing more than 100 photons and with the mean photon count rate greater than 20 ms−1. (c) Waiting time distributions in the folded (upper) and unfolded (lower) states. Exponential fitting (the first bar is excluded) results in the unfolding and folding rates, respectively. The fitted values (red) are similar to the value obtained from the maximum likelihood method (black).

