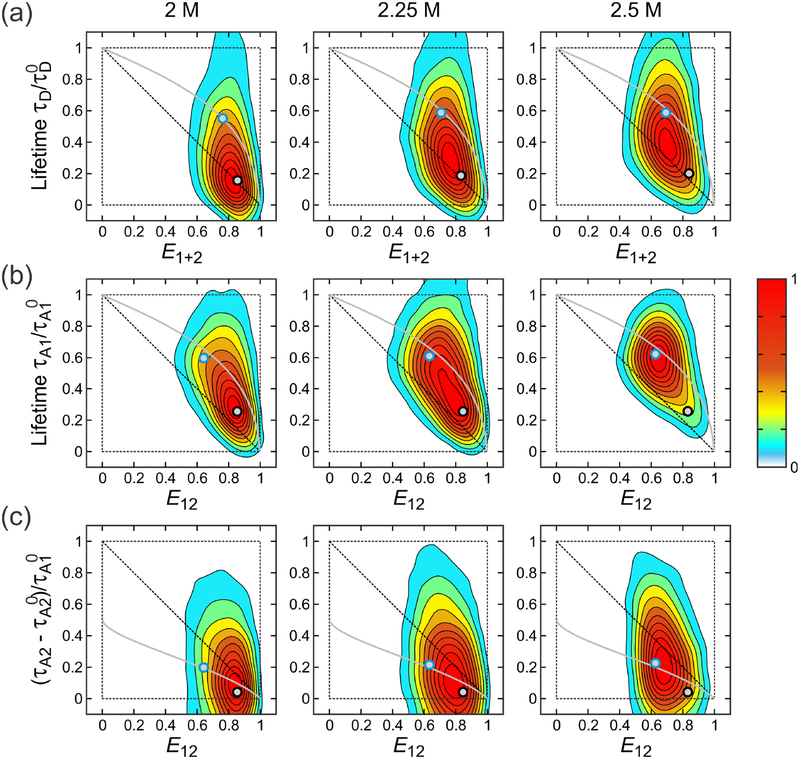
Figure 7.
2D FRET efficiency-lifetime histograms. 2D histograms were constructed for (a) E1+2 and donor delay times (D excitation), (b) E12 and A1 delay time (A1 excitation), and (c) E12 and A2 delay time (A1 excitation). is the A1 lifetime on the condition that the A1 excited state decays to A2 excited state (see eq 38). FRET efficiencies and mean delay times were calculated for each of 1 ms bins and 2D contours were smoothed as described in Ref. 51. Gray lines are the dependence of the lifetimes on E calculated for the unfolded state using the Gaussian chain model. FRET efficiencies were corrected for background, donor leak, direct acceptor excitation, and γ-factors and mean delay times were corrected for background. A2 delay times in (c) were further corrected for the leak of A1 fluorescence and direct A2 excitation. Black and blue circles filled in grey show the FRET efficiencies and lifetimes of the folded and unfolded states, respectively, obtained from the maximum likelihood analysis (see Table 3 and 4, and Figure 8). The variances of the FRET efficiency distribution of the unfolded state calculated using these values are (a) = 0.074, 0.086, 0.086, (b) = 0.085, 0.089, 0.092, (c) = 0.104, 0.097, 0.094.

