Figure 1.

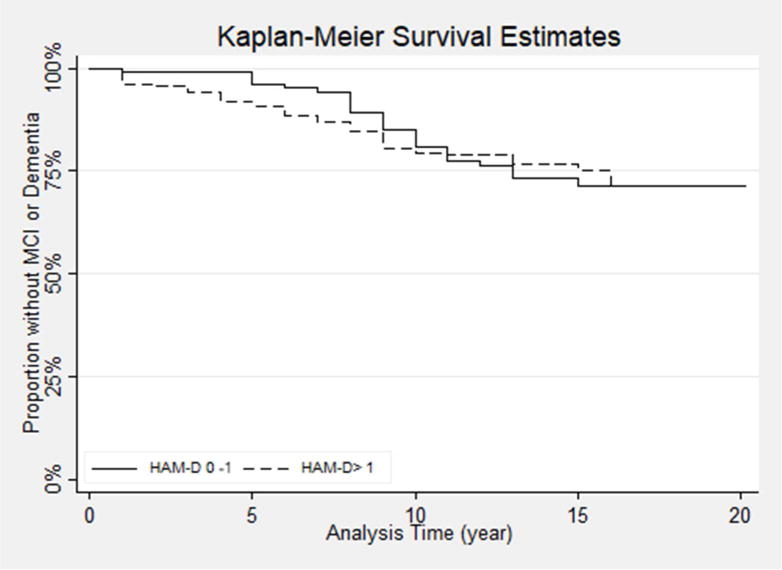
Kaplan-Meier survival curve plot showing development of incident MCI in those with Hamilton Depression Scale (HAM-D) >1 vs 0-1

Kaplan-Meier survival curve plot showing development of incident MCI in those with Hamilton Depression Scale (HAM-D) >1 vs 0-1