
Fig. 3.
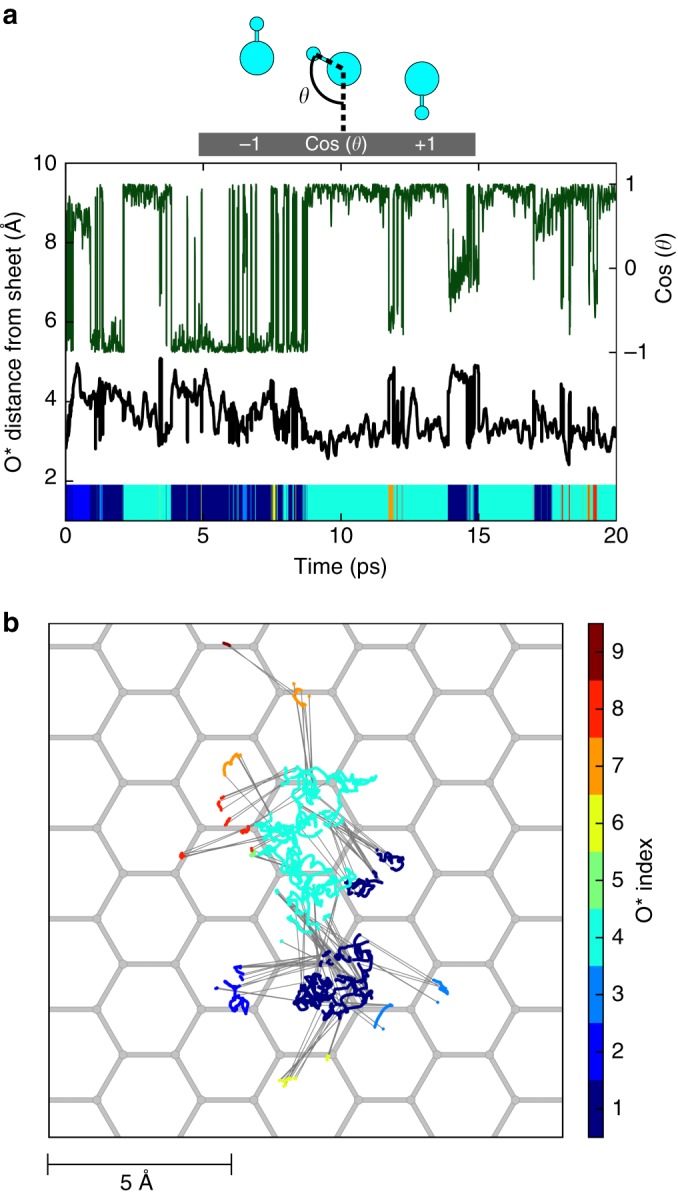
Unbiased displacements of OH− on graphene. Time variations of the vertical displacement (a, black curve) and lateral displacement (b, coloured trajectories) of a free hydroxide starting at the physisorption distance from a graphene sheet. The cosine of the hydroxide orientation with respect to the surface is also plotted vs. time (a, dark green curve). The index of the hydroxide oxygen O* is associated to a specific colour so that changes of colour represent successive proton transfers in time and hence hydroxide diffusion. Proton transfers are also indicated by thin grey straight lines on top of the carbon hexagonal grid represented in grey (b)