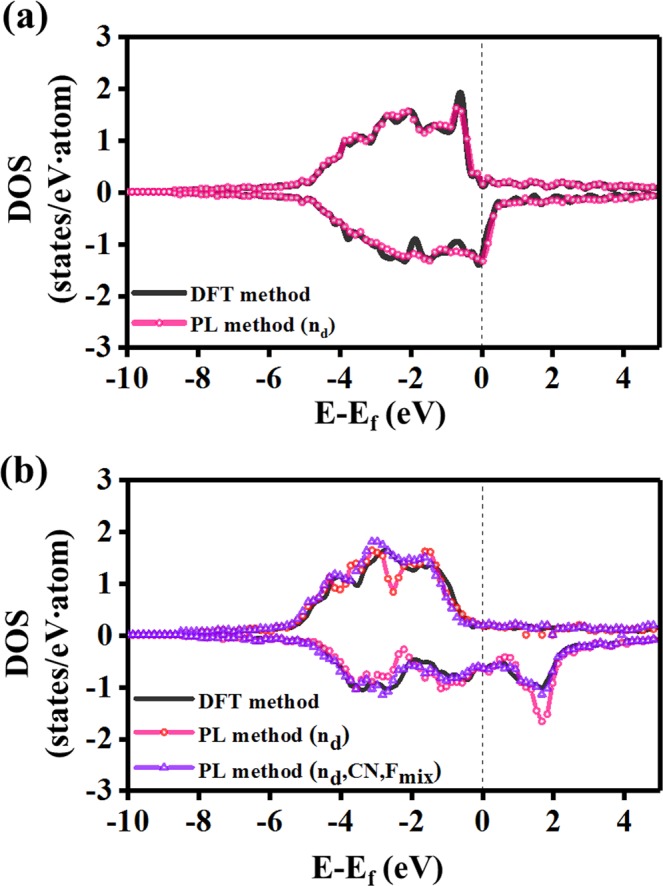
Figure 2.

Prediction results of the PL method in binary alloy systems. (a) DOS pattern of Cu0.375Ni0.625 as a test of the Cu-Ni alloy system. Its atomic structure is shown in Fig. S3. The energy range (E − Ef) is from E = −10 eV to E = 5 eV, and the DOS range is from 0.0 to ± 3.0, where the positive region is for the up-spin, and the negative region is for the down-spin. Black corresponds to the DFT method, and pink corresponds to the learning method using only one feature of nd. (b) DOS pattern of Cu0.375Fe0.625 as a test of the Cu-Fe alloy system. Its atomic structure is shown in Fig. S3. Black corresponds to the DFT method, pink corresponds to the learning method using the nd feature, and violet corresponds to the learning method using all features including nd, CN, and Fmix.
