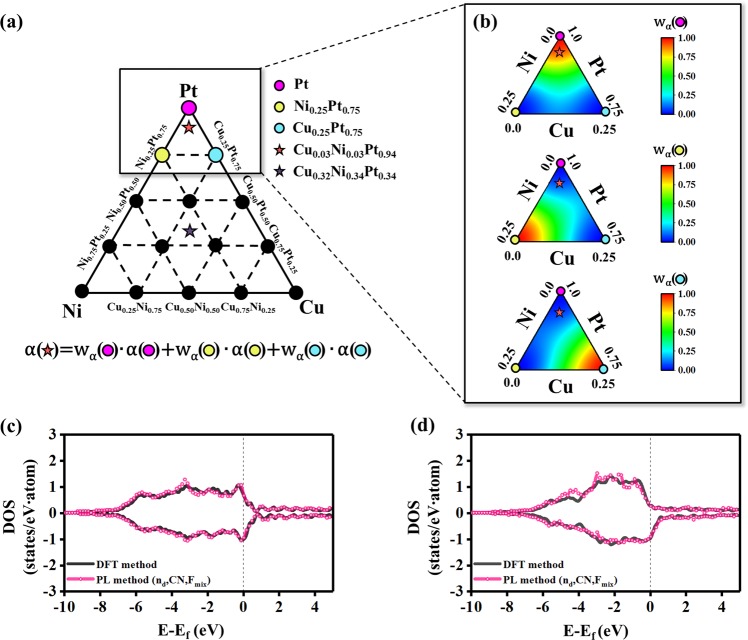
Figure 3.
Estimation of coefficients and prediction results of the PL method in ternary alloy systems. (a) Triangular diagram of the Cu-Ni-Pt system representing the training data (circle) and test data (star). The equation for the calculation of the PCs coefficients for the test data is shown at the bottom of the figure: the equation is based on the coefficients and their weights for training alloys that most closely match the test alloy composition. (b) Maps of the weights of the coefficients of the PC vectors for the test composition (Cu0.03Ni0.03Pt0.94). The weights depends on the distance between the test composition and each training composition, and they also depend on the difference of three features (nd, CN, and Fmix) between the training and test data. (c) DOS pattern of the Cu0.03Ni0.03Pt0.94 test alloy. (d) DOS pattern of the Cu0.32Ni0.34Pt0.34 test alloy. Their atomic structures are shown in Supplementary Fig. S3. In (c,d), black corresponds to the DFT method, and pink corresponds to the learning method using all features including nd, CN, and Fmix.

