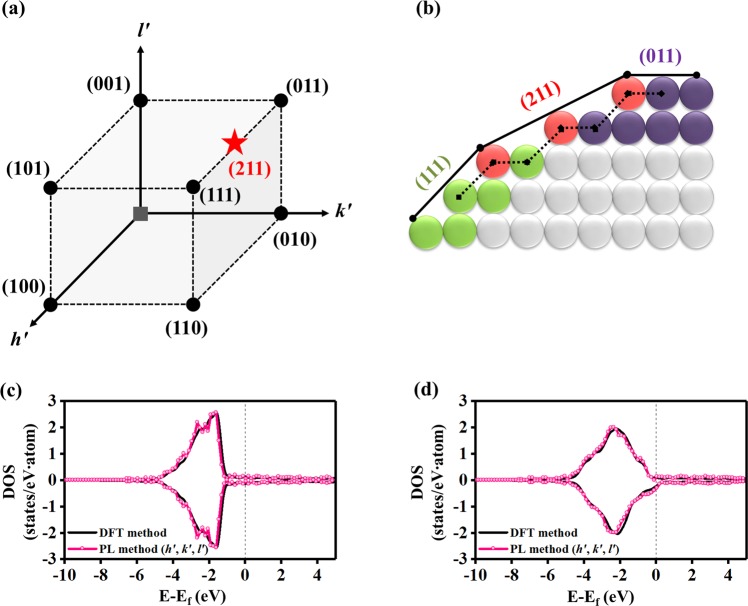
Figure 4.
Scheme of the PL method for the DOS representation of surface structures and the predicted results. (a) Two-dimensional cleaved lattice structure to represent the plane vectors of the (011) and (111) low-index surface and the (211) high-index surface. Here, red, green, and violet nodes represent the atoms on the surface layer for the (211), (111), and (011) plane vector, respectively. The dotted lines represent the periodicities of the (111) and (011) lattice vectors. (b) Three-dimensional cubic diagram of the lattice plane vectors in the coordinate system for the inverse of miller indices h′, k′, and l′ representing the training (black circle) and test (red star) data. (c) DOS pattern of the Cu (211) surface. (d) DOS pattern of the Cu0.375Ni0.625 (211) surface. In (c,d), black corresponds to the DFT method, and pink corresponds to the learning method (use of three PCs) using the inverse value of the miller index as a feature. The atomic structures of each surfaces can be found in Supplementary Fig. S4.

