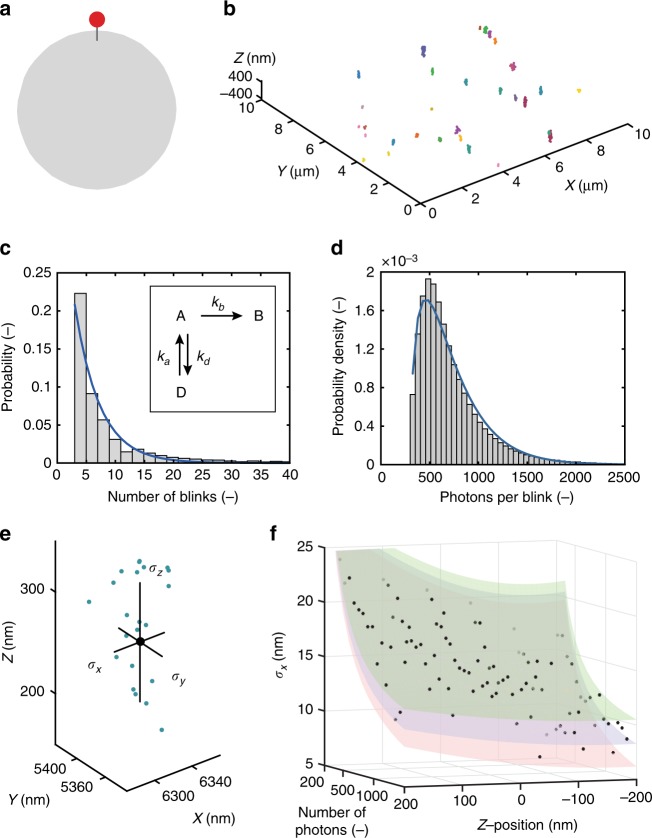
Fig. 2.
Analysis of dye photophysics through single-molecule experiments. a Schematic depiction of a mono-functional nanoparticle, obtained by reacting a large excess of carboxyl-functional polystyrene beads (diameter 330 nm) with a dilute solution of Alexa647 fluorophore. Experimental details can be found in the Methods section. b dSTORM image of mono-functional nanoparticles. Nanoparticles were immobilized on a glass coverslip and imaged using astigmatic 3D-dSTORM. c Probability distribution of the number of blinks per dye (grey bars), . The probability distribution has been fit using a conditional geometric distribution (blue line), corresponding to a three-state model. Inset: three-state model for reversible photoswitching in dSTORM imaging, including active (A), dark (D), and bleached (B) states and the corresponding transitions. d Probability density distribution of the number of photons per blink, i.e. period in the active state, (grey bars), . The probability density distribution has been fit using a conditional gamma distribution (blue line), . Details of the distributions used in c and d can be found in the Supplementary Methods. e Determination of experimental localization accuracy. Localizations corresponding to a single dye are indicated as green points, and the localization errors σx, σy, σz of a particular centroid are the distances (in the x, y, z dimensions, respectively) between this centroid and the average of all centroids corresponding to the same dye (black point). f Dependence of the experimental localization error σx on the number of photons of the localization and the estimated z-position of the dye. Black points indicate the average estimated absolute error (i.e. a measure for the experimental error of the localization process) for all localizations combined in 75 nm ×75 photon bins. Transparent surfaces indicate the localization errors predicted by different photophysical models: a basic model of the 3D fitting error (red), an extended model including fiducial marker-based drift correction (blue), and a complete normal-normal mixed model further accounting for point spread function (PSF) deformation (green). Similar graphs for the localization error in the y and z dimensions, and the width error in the x and y dimensions, are shown in Supplementary Figs. 7–9

