Fig. 6.
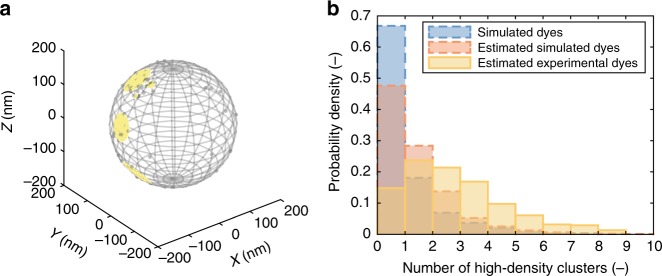
Occurrence of regions with a high functional group density. a Identification of high-density regions on the surface of a nanoparticle. High-density regions (yellow circles) are defined as containing the estimated locations of ≥5 fluorophores (grey points) in a surface region with radius ≤50 nm. b Probability mass function of the number of high-density clusters on a nanoparticle. The plot depicts distributions for the (stochastically homogeneously) simulated fluorophore locations (dashed blue, ), the (stochastically homogeneously) simulated estimated fluorophore locations (dashed red, ) and the experimentally observed nanoparticles (solid yellow, )

