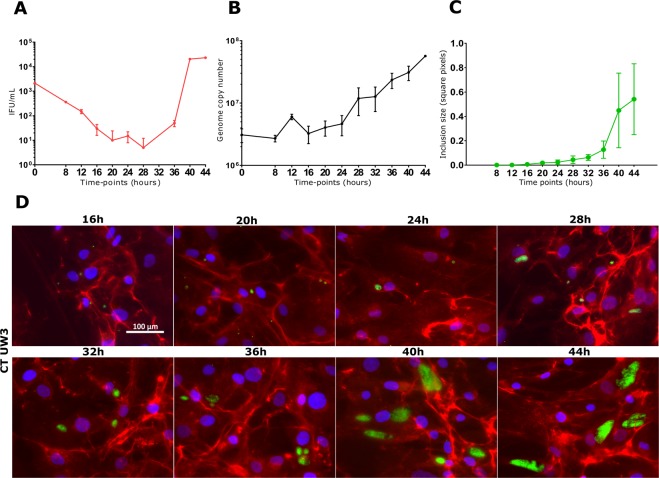
Figure 2.
Growth kinetics of C. trachomatis in primary human Sertoli cells. Infectivity profile (A), chromosomal replication (B), quantification of the inclusion size (C) and fluorescence micrographs (D). Infected primary human Sertoli cells were removed for analysis at 4 hourly intervals and then titrated to assess the quantity of IFUs and the relative number of chlamydial genomes by qPCR. Values are expressed as means ± SD of four replicates from two independent experiments. Chlamydial inclusions were visualized by indirect immunofluorescence with species-specific anti-MOMP monoclonal antibodies (Mab6ciii). Representative images of ten chlamydial inclusion per time-point are shown. Mean and standard deviation of inclusion size, expressed as square pixels, were measured from fluorescence micrographs using ImageJ software.

