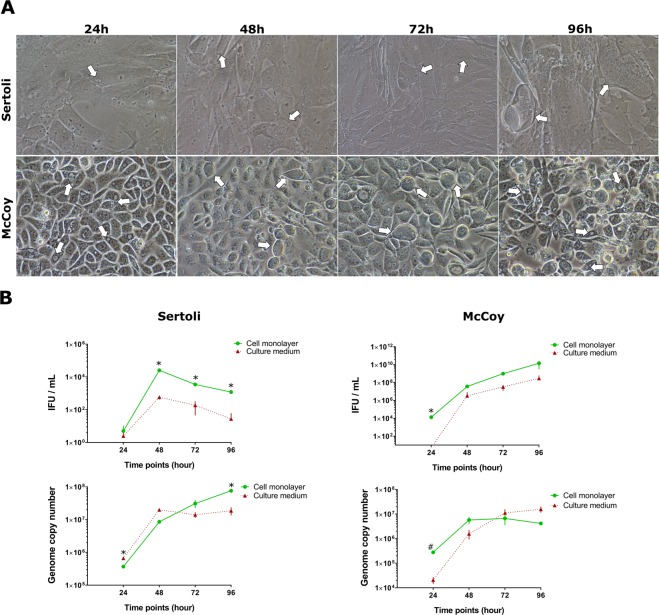
Figure 3.
Reduced cell lysis of C. trachomatis infected primary human Sertoli compared with McCoy cells. Phase contrast micrographs (A) and one-step infectivity growth profiles and chromosome replication (B) of C. trachomatis in Sertoli and McCoy cells at 24 hourly intervals up to 96 hours post infection. Values are expressed as means ± SD of four replicates from two independent experiments. Representative images of ten chlamydial inclusions per condition are shown. White arrows indicate inclusions. *cell monolayer vs culture medium p < 0.01; #cell monolayer vs culture medium p < 0.05.

