Fig. 1.
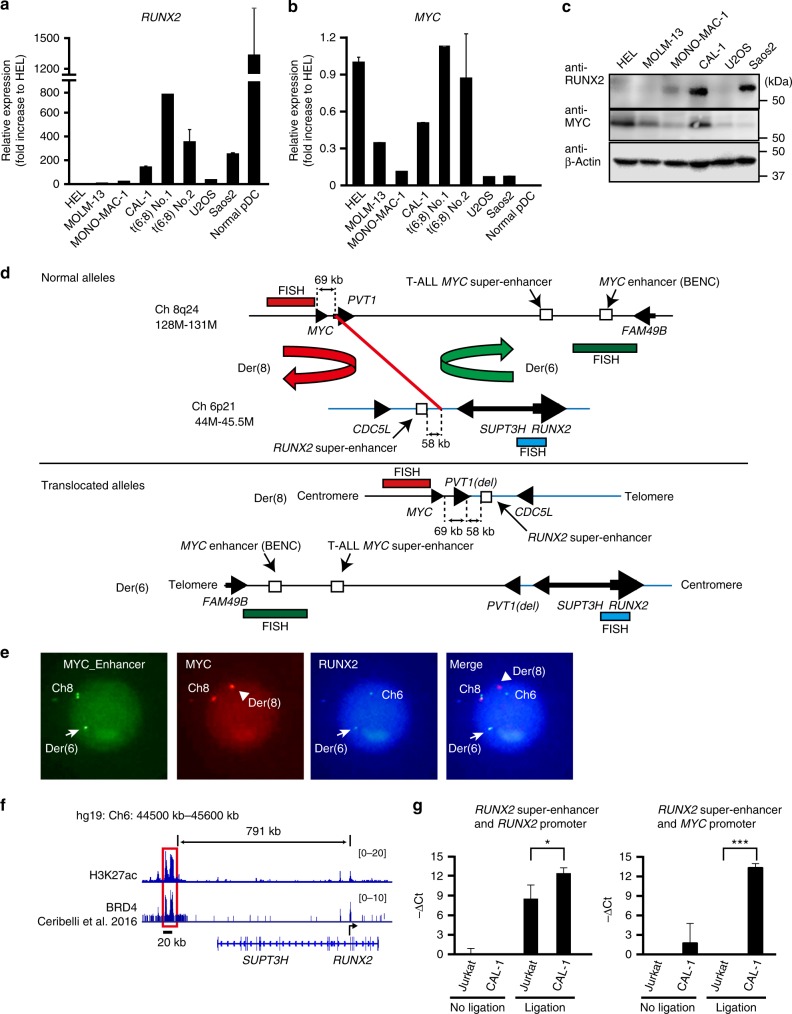
Enhanced expression of MYC in BPDCN cells harboring t(6;8). a Expression levels of RUNX2 mRNA in acute leukemia cell lines (HEL, MOLM13, and MONO-MAC1), CAL-1, bone marrow mononuclear cells harboring t(6;8) isolated from two patients (#1 and #2), and osteosarcoma cell lines (Saos2, U2OS) examined by quantitative RT-PCR (q-PCR) compared to those in normal pDCs isolated from healthy donors (n = 5). b Expression levels of MYC mRNA examined by q-PCR in the same cells described in Fig. 1a. c Expression levels of RUNX2 and MYC proteins in acute leukemia cell lines (HEL, MOLM13, and MONO-MAC1), CAL-1, and two osteosarcoma cell lines (Saos2, U2OS). Levels of β-Actin were used as loading controls. d Maps showing chromosomal regions of human 8q24 (129M-131M) (black line) and 6p21 (44M-47M) (blue line) (upper panel) and derivative chromosome regions of Der(6) and Der(8) (lower panel). Red line indicates a fusion point of t(6;8)(p21;q24) in CAL-1 cells identified by whole genome sequencing in this study. Red, green, and aqua bars indicate the target regions of FISH probes in Fig. 1e. e Association between the 3′ enhancer region of MYC (green signals) and the RUNX2 gene (aqua signals) observed in Der(6) in a patient (#2) assessed by FISH. Arrows and arrow heads show Der(6) and Der(8), respectively. f CAL-1 cells showing a long and clustered enhancer of RUNX2 (hg19: 44500kb−45600kb) assessed by ChIP sequencing utilizing either an anti-H3K27ac in this study or anti-BRD4 antibody12. g CAL-1 cells showing a significant association between the super enhancer of RUNX2 and the promoter of either MYC or RUNX2 assessed by a 3C-qPCR assay. DNA ligase non-treated samples were used as negative controls. Data are representative of three independent experiments. a, b, g Bars show the mean±SD, *p < 0.05, and ***p < 0.001 by the Student’s t-test

