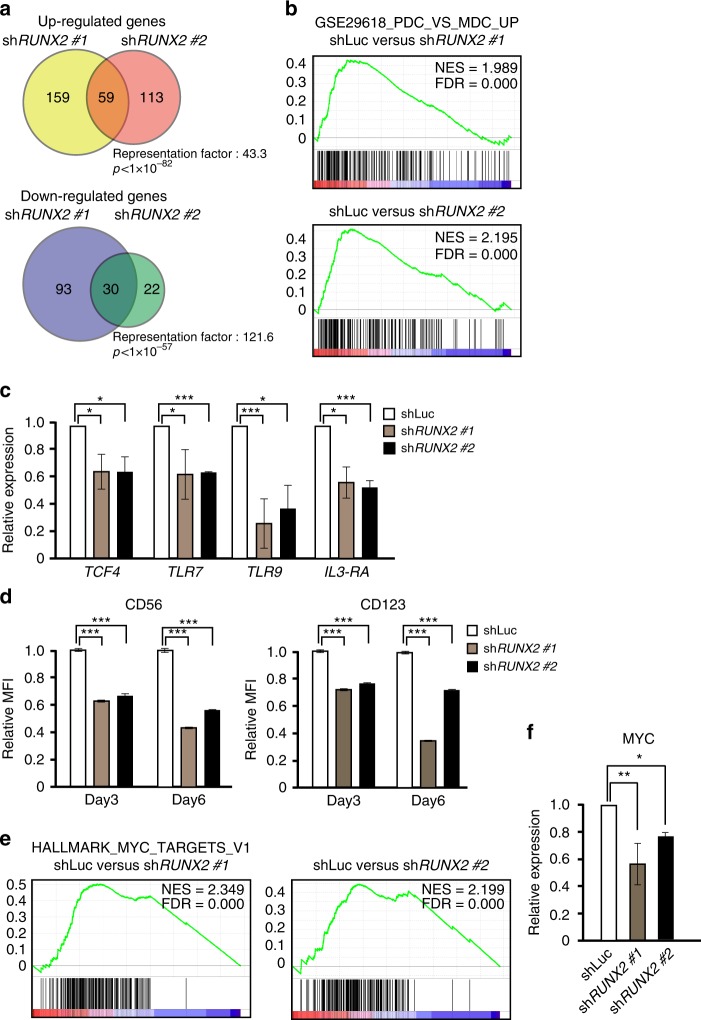
Fig. 3.
RUNX2 functions as a lineage-specific transcription factor in BPDCN. a Venn diagrams of significant overlaps in up-regulated and down-regulated genes between two distinct RUNX2 KD CAL-1 cells relative to control CAL-1 cells. b GSEA for pDC signature genes, which was defined by up-regulated genes in normal pDCs versus mDCs (GSE29618), in two RUNX2 KD CAL-1 cells relative to control CAL-1 cells. c q-PCR showing the reduced expression of pDC signature genes, such as TCF4, TLR7, TLR9, and IL3-RA, in RUNX2 KD CAL-1 cells (gray and black bars). d Decreased mean fluorescence intensities (MFI) of CD56 and CD123/IL3-RA expression in RUNX2 KD CAL-1 cells (gray and black bars) 3 and 6 days after transduction examined by FACS (n = 3). e GESA for canonical MYC target genes (Hallmark MYC targets V1) in two RUNX2 KD CAL-1 cells relative to control CAL-1 cells. f Expression levels of MYC mRNA examined by q-PCR in RUNX2 KD CAL-1 cells (gray and black bars) and control CAL-1 cells (opened bar). c, d, f Bars show the mean±SD, *p < 0.05,**p < 0.01, and ***p < 0.001 by the Student’s t-test. Data are representative of three independent experiments

