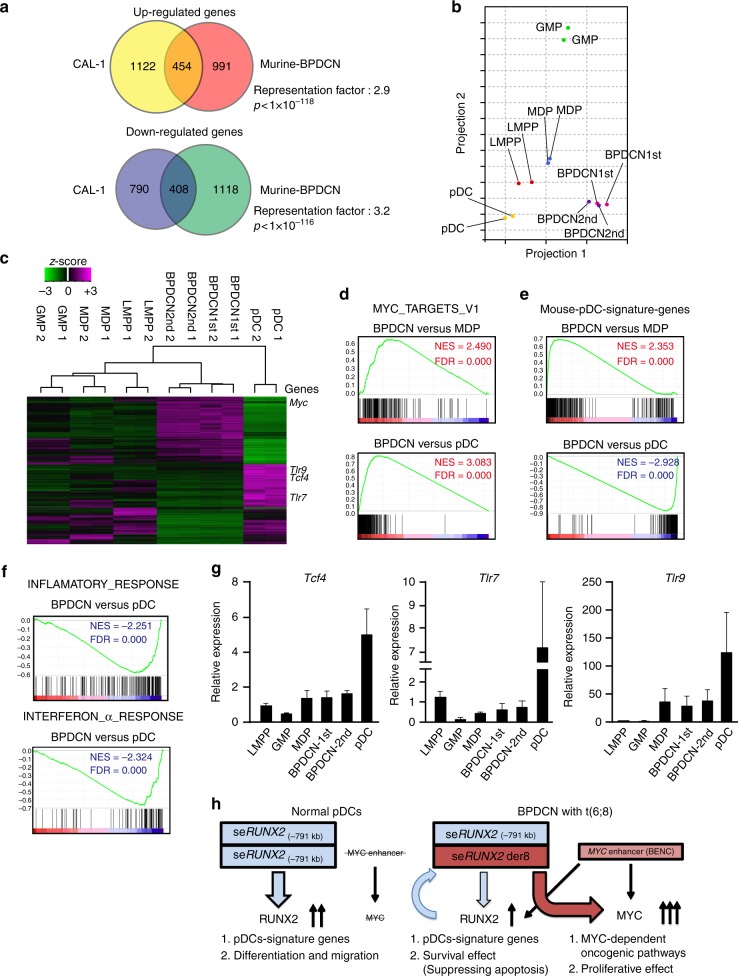
Fig. 8.
BPDCN cells activate MYC-mediated oncogenic pathways but impede the activation of pDC-signature genes. a Venn diagrams of significant overlaps in up-regulated genes and down-regulated genes in comparisons of MYC+RUNX2-DKO leukemic cells with murine pDCs and CAL-1 cells with human pDCs examined in GSE6201434. b A principal component analysis based on total gene expression in LMPPs (red dots), MDPs (blue dots), GMPs (green dots), and pDCs (yellow dots) isolated from wild-type mice and MYC+RUNX2-DKO leukemic cells isolated from two distinct primary mice (pink dots) and secondary transplanted mice (purple dots). c Hierarchical clustering based on differentially expressed genes between leukemic cells and wild-type pDCs (e.g. Myc, Tcf4, Tlr7, and Tlr9) in the same cells utilized in Fig. 8b. d GSEA plots for canonical MYC target genes comparing MYC+RUNX2-DKO leukemic cells to MDPs and pDCs isolated from WT mice. Normalized enrichment score (NES) and false discovery rate (FDR) q-values are indicated in Fig. 8d–f. e GSEA plots for pDC-signature genes, which were defined by the expression levels of genes in wild-type pDCs (≥3-fold change, p < 0.001 significantly different from the levels of other fractions), comparing MYC+RUNX2-DKO leukemic cells to MDPs and pDCs isolated from WT mice. f GSEA plots for inflammatory response and interferon α response comparing MYC+RUNX2-DKO leukemic cells to WT pDCs. g Quantitative RT-PCR analysis of the expression of Tcf4, Tlr7, and Tlr9 in LMPPs, MDPs, GMPs, and pDCs isolated from wild-type mice and MYC+RUNX2-DKO leukemic cells (n = 3). Bars show the mean±SD. h Model showing the functions of seRUNX2 (−791 kb) in normal pDCs and seRUNX2 der8 in BPDCN cells

