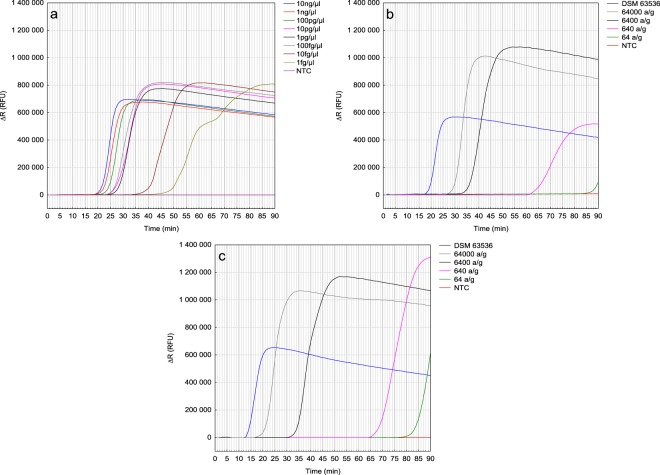
Figure 3.
Sensitivity study of Talaromyces flavus LAMP detection method. (a) The amplification plots (∆R) of pure genomic T. flavus DSM 63536 DNA added into reaction in different concentrations in time. (b) The amplification plot (∆R) of T. flavus detected in strawberries contaminated by different number of ascospores added to 1 g of sample (a/g) prior the DNA isolation reaction. DNA isolated with EURx Plant&Fungi DNA Purification Kit. (c) The amplification plot (∆R) of T. flavus detected in soil contaminated by different number of ascospores added to 1 g of sample prior the DNA isolation reaction. NTC stands for non-template control. DNA isolated with EURx Soil DNA Purification Kit.

