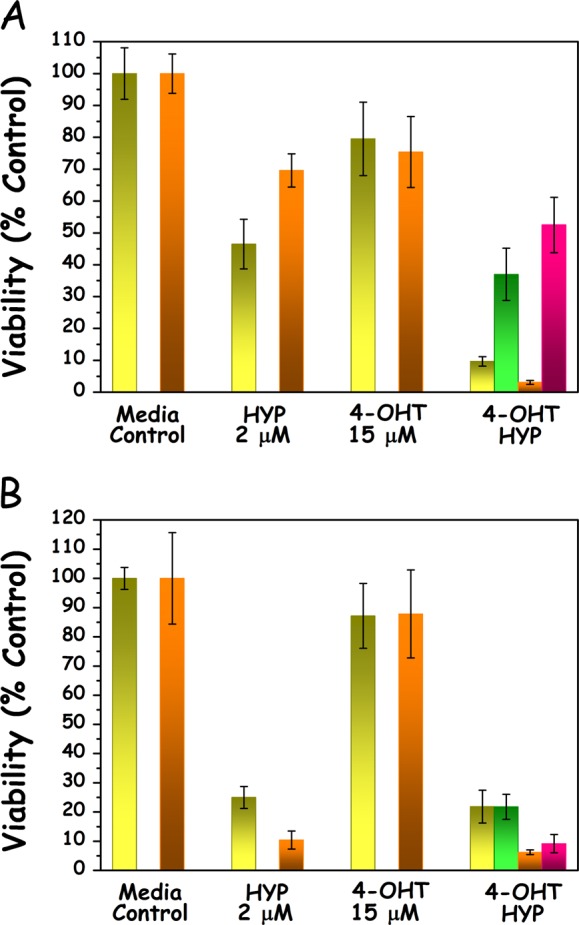
Fig. 1.

The effects of HYP-PDT and 4-OHT combinatorial treatment (HYPERTAM). a MCF7 and b MDA-MB-231 cells. The MTT-derived viabilities are shown in yellow for 24 h post-irradiation and orange for 48 h post-irradiation. The calculated HYPERTAM 24 h viability values by extrapolation from the HYP-PDT and 4-OHT mono-treatments appear in green. The corresponding 48 h calculated values appear in pink. A HYPERTAM synergistic effect is only evident in MCF7 cells at these timeframes. The data shown are representative from one of at least three replicate experiments. The error bars represent STD values on eight parallels
