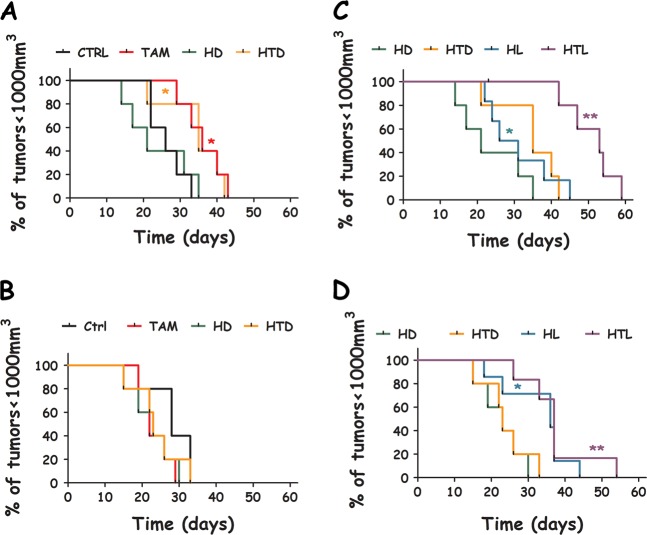
Fig. 5.
Survival of xenograft-bearing mice following HYPERTAM. NSG mice endpoints (tumor volume ≥ 1000 mm3) shown as Kaplan–Meier plots for the different treatment groups of the MCF7 (a, c) and MDA-MB-231 (b, d) tumor models. CTRL (untreated), HD (HYP dark), TAM (tamoxifen only), HTD (HYP+TAM dark), HL (HYP-PDT), HTL (HYPERTAM). The error bars represent STD from the mean of seven parallels. The statistical significance was calculated using the log-rank (Mantel–Cox) test; ns p ≥ 0.05, *p < 0.05 and **p < 0.005

