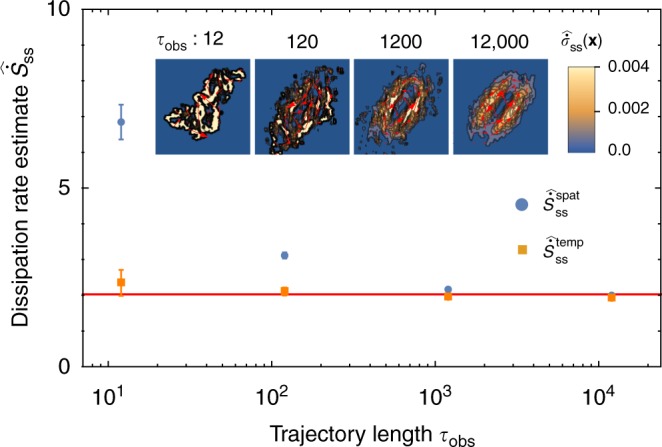
Fig. 2.

Convergence of dissipation estimates. The spatial (blue solid circles) and temporal (red solid squares) dissipation rate estimates converge to the steady-state value (red line) of Eq. (7). Estimates of the total dissipation rate, calculated from Eqs. (12) and (13), are extracted from Langevin trajectories simulated for time τobs with timestep 10−3 using k = γ = 1, kBTc = 25, and kBTh = 250 as in Fig. 1. Error bars are the standard error of the mean, computed from 10 independent trajectories. Estimates of the local dissipation rate from the spatial estimator with different trajectory lengths are plotted in the inset
